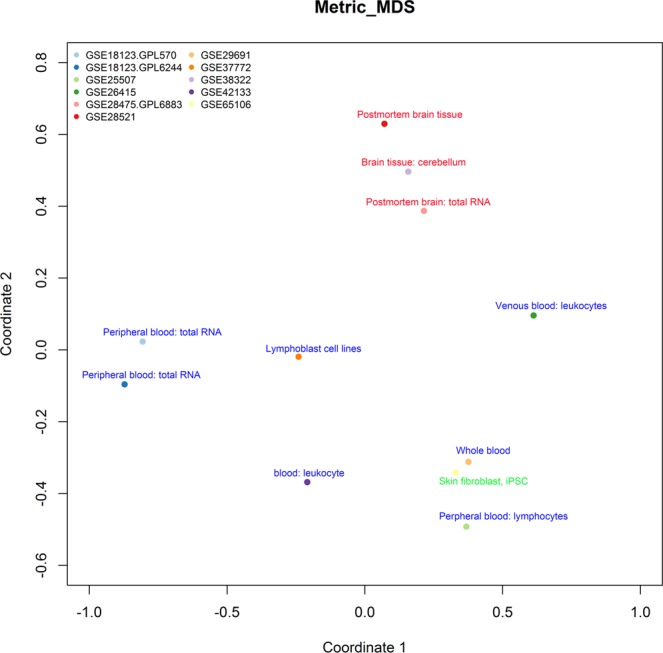
Figure 1.

Multidimensional scaling map of 11 series of datasets. Multidimensional scaling analysis was performed among these datasets based on the distance matrix. Each dot represented a series of dataset. For each dataset, the tissue source was noted on the dot, brain tissues were presented by red, blood was presented by blue. Spatial distance among datasets derived from same tissue was smaller than that derived from different tissues (P = 0.0013). That meant datasets coming from same tissue had bigger similarity.
