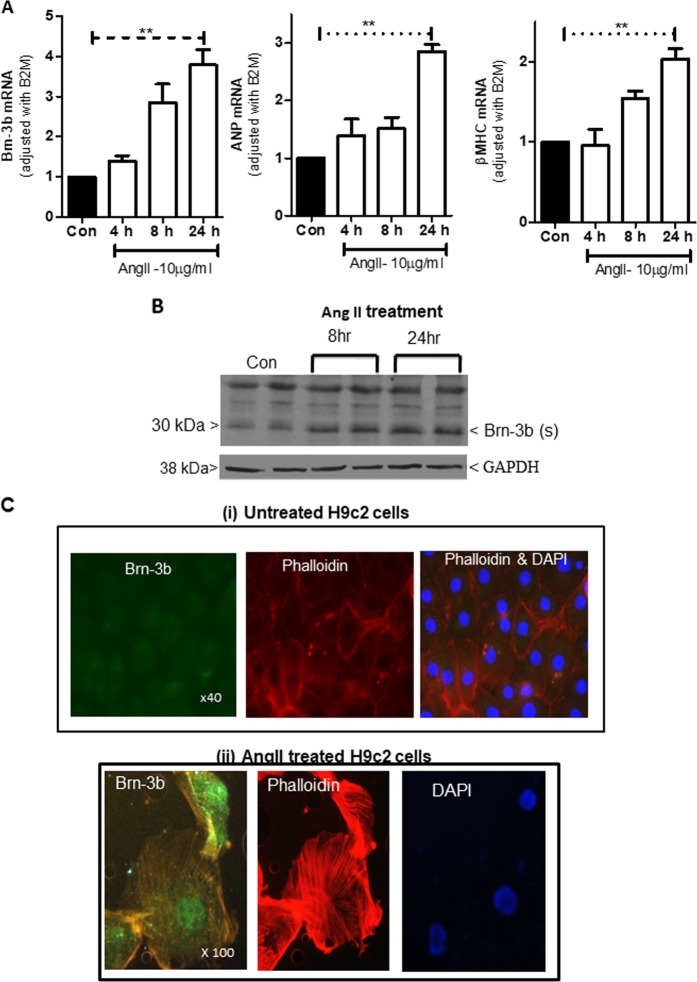
Fig. 3. Brn-3b induction by AngII in H9c2 cell cultures.
a qRT-PCR data showing changes in mRNA encoding Brn-3b, ANP and β-MHC in H9c2 cells treated with 10 µg/ml of AngII for 4, 8 or 2 h when compared with untreated controls (Con). Variation between RNA samples was standardised using B2M, and values are expressed relative to the untreated control cells set at 1. Data represent values from six independent experiments and **p < 0.01, where (n = 6). b Representative western blot analysis showing induction of Brn-3b(s) protein following treatment with 10 µg/ml AngII for 24 h and the invariant GAPDH protein indicates any variability in protein loading. c Representative immunofluorescent images showing Brn-3b protein localisation (green) in AngII-treated H9c2 cells stained with phalloidin (red) to show cytoskeletal re-modelling. DAPI staining (blue) shows the cell nuclei. Untreated control cells are shown at ×40 to demonstrate little protein expression in a larger field of view, whereas ×100 magnification of AngII-treated cells highlights nuclear Brn-3b expression in cells that display extensive cytoskeletal remodelling

