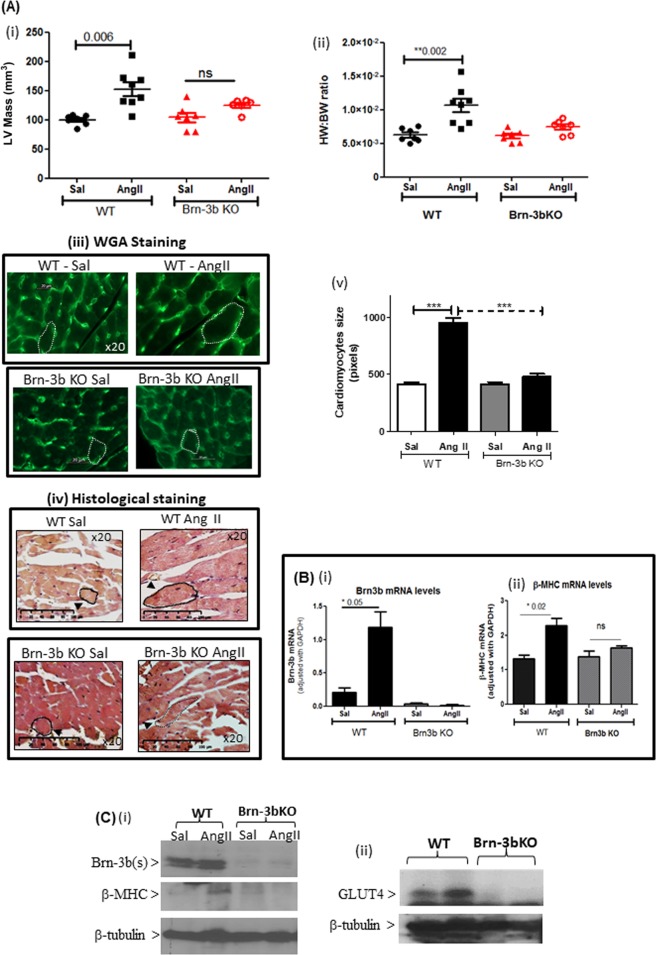
Fig. 7. Attenuated hypertrophic responses to AngII in Brn-3b KO hearts.
Echocardiography data showing changes in (i) LV mass or (ii) HW:BW ratio, in hearts from male Brn-3b KO (KO) mice and age-matched, WT control mice following AngII or saline infusion for 4 weeks. Groups of 6–8 mice were used and data represent the mean and standard error.**p < 0.01 using either students t test or two-way ANOVA and post-hoc Bonferroni analyses. (iii) Representative images showing changes in cardiomyocyte size in hearts taken from WT or Brn-3b KO mice, infused with either saline (Sal) or AngII and stained with wheat germ agglutinin (WGA) or (iv) histochemical staining, e.g Masson’s trichrome. Images shown at ×20 magnification. Dotted lines show representative cell surface area used for analysing differences in cardiomyocyte size in wild-type or Brn-3b KO hearts following AngII-treated and compared with appropriate saline controls (v) The mean ± SEM of cell surface area measurements taken from multiple hearts (n ≥ 3 independent hearts) with >30 cells analysed from each heart section. b Data from qRT-PCR to analyse changes in (i) Brn-3b or (ii) β−MHC mRNA in hearts taken from AngII or saline-treated WT male mice or Brn-3b KO mutants. c Representative western blots showing changes in protein expression, as indicated, in hearts taken from WT and Brn-3b KO mutants, treated with AngII or saline controls (Sal). β-tubulin blots show difference in total protein between samples

