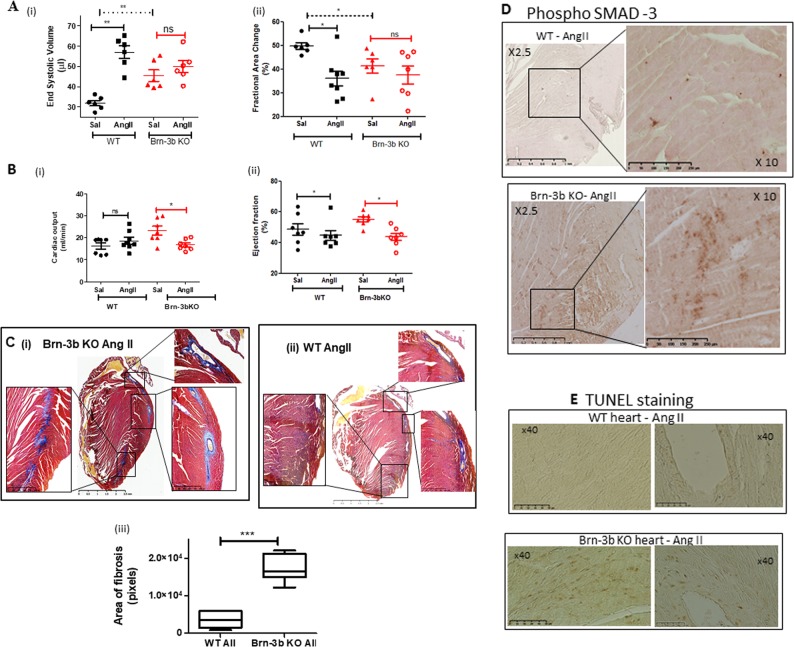
Fig. 8. Reduced cardiac function in male Brn-3b KO hearts following AngII treatment.
a. Echocardiography data showing changes in (i) end systolic volumes or (ii) fractional area change in Brn-3b KO hearts compared with WT control either in control saline (Sal) hearts or hearts infused with AngII (AII) for 4 weeks. Significant differences between groups are indicated by (**), as determined either using Students t test or two-way ANOVA and Bonferroni post-hoc test. b Changes in cardiac output (i) or ejection fraction (ii) in untreated control (Sal) WT or Brn-3b KO mice or treated with AngII for up to 4 weeks. Data represents the mean and standard error from 6–8 mice per group. Statistical significance between groups was determined using Students t test or two-way ANOVA and Bonferroni post-hoc test (*<0.05; **<0.01). c Representative images showing Masson’s trichrome staining of hearts sections prepared from (i) Brn-3b KO mice treated with AngII, or (ii) WT control mice treated with AngII. Images were captured using Hammamatsu Nanozoomer imaging system and shown at ×1.5–40 magnification. Red/Pink staining represent cytoplasm staining in muscle cells, dark purple/black indicates cell nuclei and blue staining indicates deposition of extracellular matrix proteins e.g. collagen. (iii) Graph representing differences in the areas with signs of fibrosis (increased ECM deposition) in WT or Brn-3b heart following AngII treatment. Areas of fibrosis were measured using image J in ≥5 independent heart sections, shown as ± SEM and significance determined using students t test (***p < 0.001). d Representative images showing anti-phospho-SMAD 3 antibody DAB immunostaining in sections of hearts taken from AngII-treated mice as indicated [WT mice (top panel) or Brn-3b KO mice (lower panel)]. Positive cells are stained brown in images shown either at lower magnification (×2.5) to highlight the extent of increased SMAD protein expression in AngII-treated Brn-3b KO hearts or at higher magnification (×10) displays the intensity of staining. e Representative TUNEL staining in heart sections taken from AngII-treated WT mice (top panel) or Brn-3b KO mice (lower panel). TUNEL positive cells appear brown in the images (shown at ×40 magnification)

