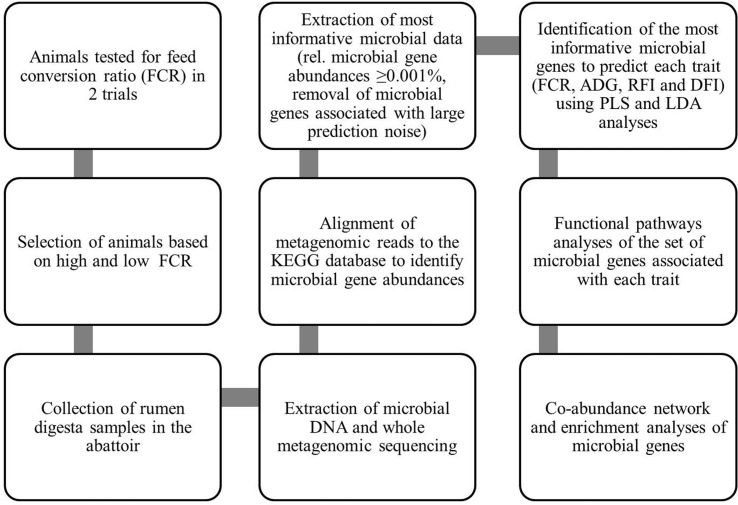
Figure 1.
Flowchart summarizing methods for generation of data and their statistical analyses: This flowchart summarizes how the data were generated and which statistical analyses were used to identify the associations between gene abundances and performance traits of animals to understand the rumen microbial functional pathways associated with these traits. KEGG, Kyoto Encyclopedia of Genes and Genomes; FCR, feed conversion ratio; ADG, average daily gain; RFI, residual feed intake; DFI, daily feed intake; PLS, partial least squares; LDA, linear discriminant analysis.

