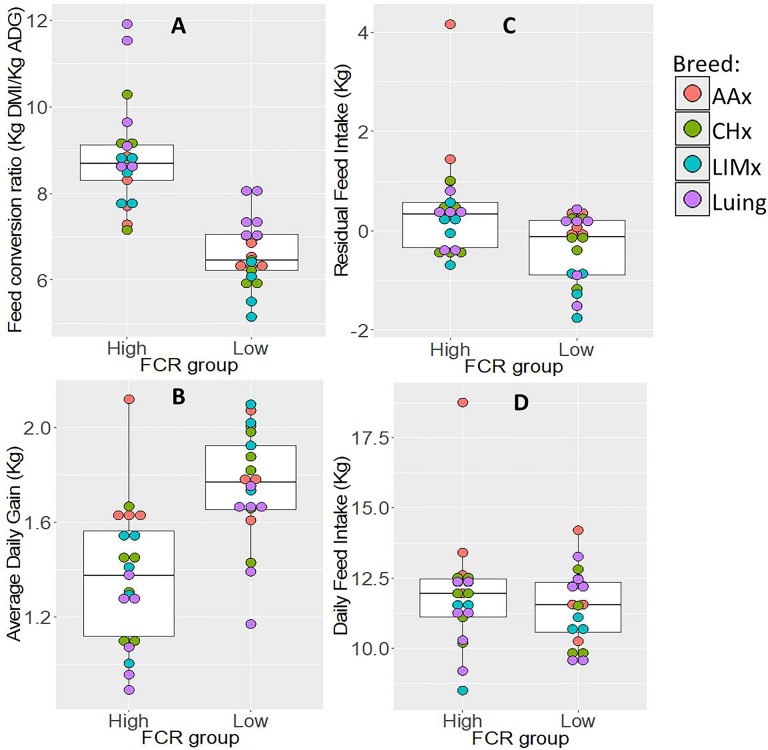
Figure 2.
Distribution of variation and range of performance traits: (A) feed conversion ratio, (B) average daily gain, (C) residual feed intake, and (D) daily feed intake within feed conversion ratio groups (high and low). The boxplots show the variation and range of each trait within each feed conversion ratio group. FCR, feed conversion ratio; AAx, crossbred Aberdeen Angus; CHx, crossbred Charolais; LIMx, crossbred Limousin.

