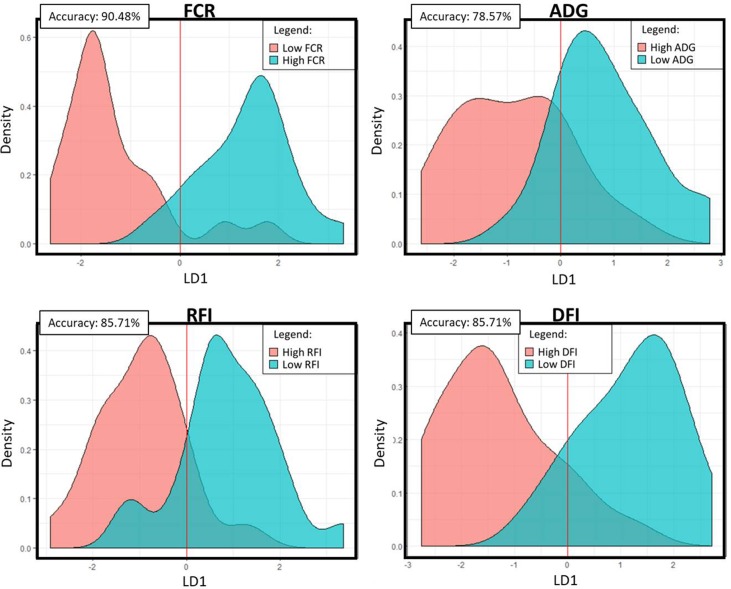
Figure 3.
Linear discriminant analysis density plots: Microbial genes identified in the PLS analyses to be significantly associated with the trait were used in a linear discriminant analysis of high- and low-performing animals. The density plots represent the predicted categories for each trait. The accuracy value represents the percentage of animals that were correctly assigned to their category. FCR, feed conversion ratio; ADG, average daily gain; RFI, residual feed intake; DFI, daily feed intake; LD1, linear discriminant 1.

