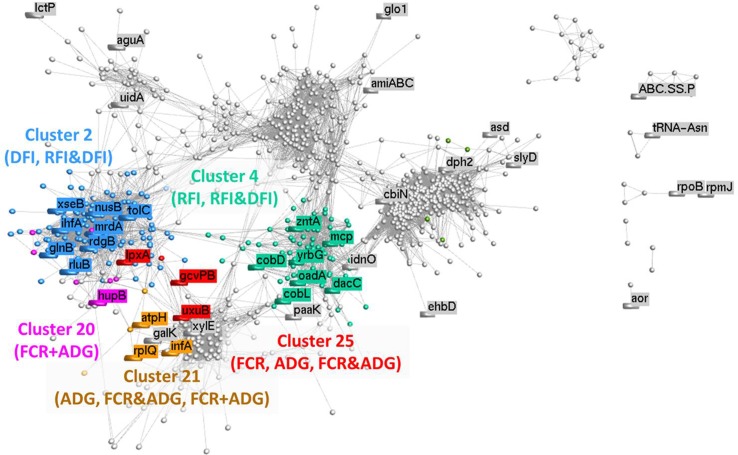
Figure 5.
Correlation network analysis of metagenomic data: Each node represents a vector of relative abundances of each microbial gene in all 42 animals, and the edges represent a correlation between the microbial genes. A minimum correlation threshold of 0.80 was applied to the network. Different colors illustrate different clusters, which were calculated using MCL method (inflation: 2; preinflation: 2; scheme: 6). Clusters identified by numbers were found to be significantly (P < 0.05) enriched for microbial genes identified for the traits whose abbreviations are between brackets (FCR, feed conversion ratio; ADG, average daily gain; RFI, residual feed intake; DFI, daily feed intake; FCR&ADG, set including microbial genes identified for prediction of either FCR and/or ADG; RFI&DFI, set including microbial genes identified for prediction of RFI and/or DFI; FCR+ADG, set including microbial genes simultaneously identified for prediction of both traits FCR and ADG).

