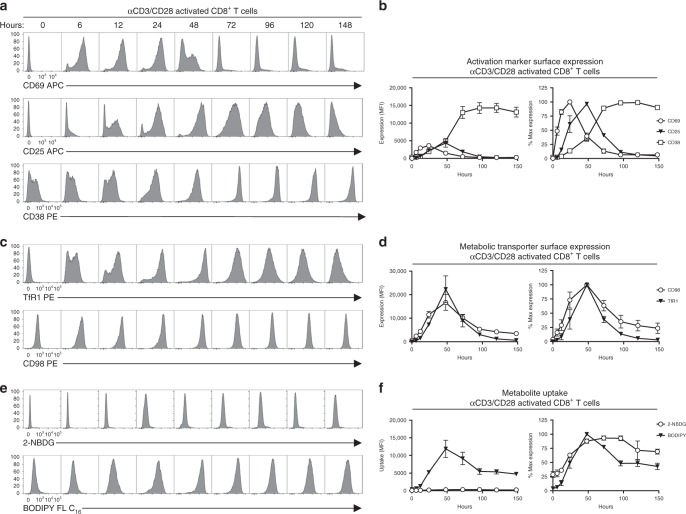
Fig. 4.
In vitro activated T cells can be identified by changes in metabolite transporter expression and metabolite utilization. CD8+ T cells from healthy donors were analyzed by flow cytometry at the indicated time points after in vitro stimulation with 0.1 μg ml−1 αCD3 and 1 μg ml−1 αCD28. T cell activation was assessed based on expression of a, b CD69, CD25, c, d TfR1, CD98, and e, f 2-NBDG BODIPY FL-C16 uptake. Error bars show mean and SEM. Results are representative of two independent experiments with a total of four individual donors. Source data are provided as a Source Data file

