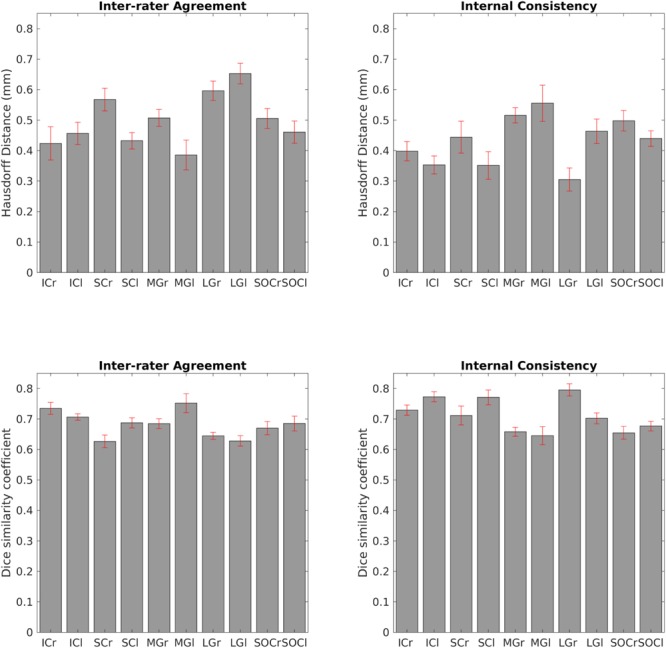
FIGURE 6.

Atlas validation. Upper left: inter-rater agreement of nuclei labels (bar/error bar = mean/s.e. modified Hausdorff distance across 12 subjects). Upper right: internal consistency of nuclei labels across subjects (bar/errorbar = mean/s.e. modified Hausdorff distance across 12 subjects). Lower left: Dice similarity coefficient (range: 0–1) of the inter-rater agreement (bar/error bar = mean/s.e. Dice similarity coefficient across 12 subjects) Lower right: Dice similarity coefficient (range: 0–1) of the internal consistency (bar/error bar = mean/s.e. Dice similarity coefficient across 12 subjects). The labels of the IC, SC, MG, LG and SOC displayed good spatial overlap across raters and subjects (i.e., modified Hausdorff distance smaller than the imaging resolution and Dice similarity coefficient higher than 0.63), thus validating the probabilistic nuclei atlas.
