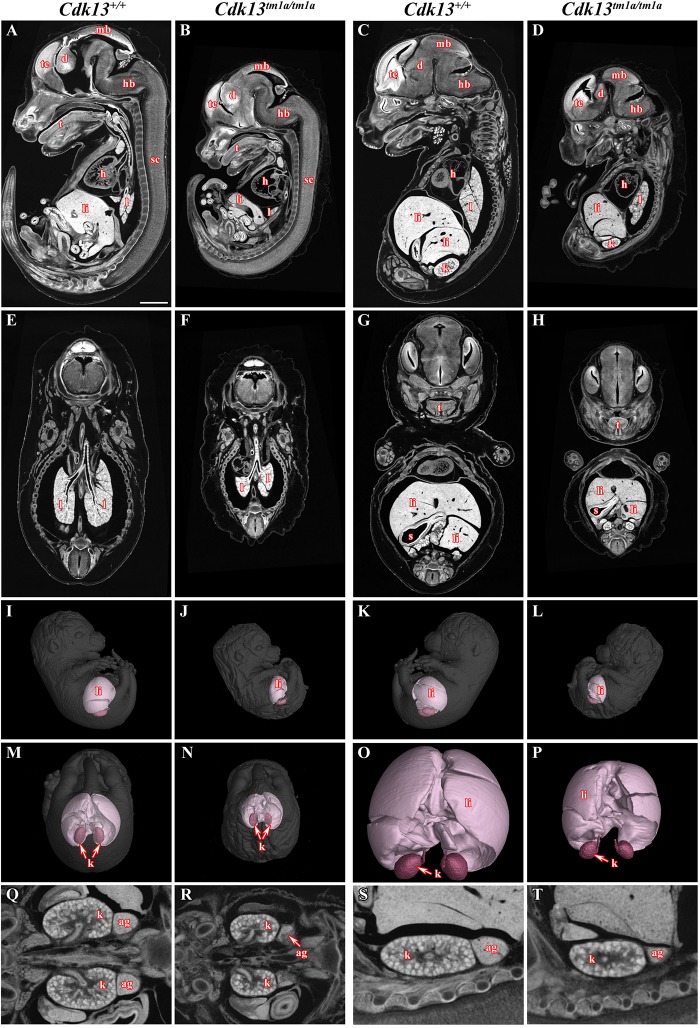
FIGURE 3.
MicroCT analysis of wild-type and Cdk13tm1a/tm1a embryos. High-contrast differentiation resolution by X-ray computed microtomography, where Lugol’s staining was used to visualize the soft tissues. Sagittal sections through body midline (A,B) and more lateral plane at E15.5 (C,D). Horizontal sections through lung (E,F) and liver (G,H). 3D reconstruction of kidney and liver in the right side view of embryo (I,J), left side view (K,L) and caudal view (M,N) with embryo outlined in gray where segmentation of serial sections was used for the liver and kidney reconstruction. (O,P) High power of 3D imaging for liver and kidney. Horizontal view (Q,R) and sagittal detailed view (S,T) on kidney and suprarenal gland. Abbreviation used for individual organs: ag, adrenal gland; d, diencephalon; h, heart; hb, hindbrain; k, kidney; l, lung; li, liver; mb, midbrain; t, tongue; te, telencephalon; s, stomach; sc, spinal cord. Scale bar = 1 mm.

