
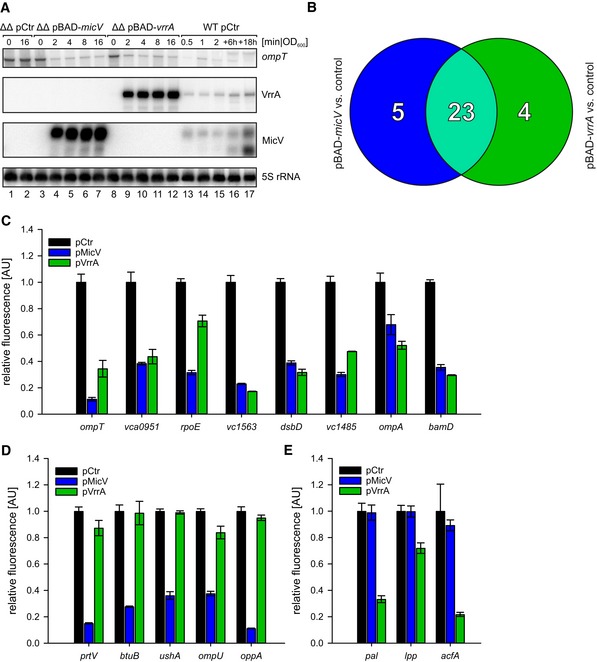
Figure 2. Target profiles of MicV and VrrA.
-
AVibrio cholerae ΔvrrA ΔmicV strains carrying pBAD‐micV, pBAD‐vrrA, or an empty vector control (pCtr) were cultivated to early stationary phase (OD600 of 1.5) in LB medium. Cells were treated with L‐arabinose (0.2% final conc.), and RNA samples were collected at the indicated time points after induction. Northern blot analysis was performed to determine VrrA, MicV, and ompT levels. 5S rRNA served as loading control. For comparison, RNA samples of a wild‐type strain carrying pCtr were collected during various growth phases, which indicated ˜18‐fold and ˜7‐fold higher levels of VrrA and MicV expressed from the pBAD plasmids, respectively (see Source data for quantifications).
-
BVenn diagram summarizing the RNA‐Seq results: RNA samples were collected from V. cholerae ΔvrrA ΔmicV strains carrying pBAD‐micV, pBAD‐vrrA, or an empty vector control. Depicted are genes displaying a fold change of ≥ 3 and FDR‐adjusted p‐value ≤ 1E‐8 obtained from MicV‐expressing conditions (blue) or vrrA‐expressing conditions (green). Genes regulated by both sRNAs (fold change ≥ 3 in one condition, fold change ≥ 2.0 in the other) are depicted in light green.
-
C–EVibrio cholerae ΔvrrA ΔmicV strains carrying the indicated reporter plasmids (x‐axis) and either an empty vector control (pCtr), the pMicV, or the pVrrA plasmid were cultivated in M9 minimal medium, and GFP fluorescence was measured. Fluorescence of the control strains was set to 1. The target genes were classified according to (B): regulated by both sRNAs (C), regulated only by MicV (D), or regulated only by VrrA (E).