-
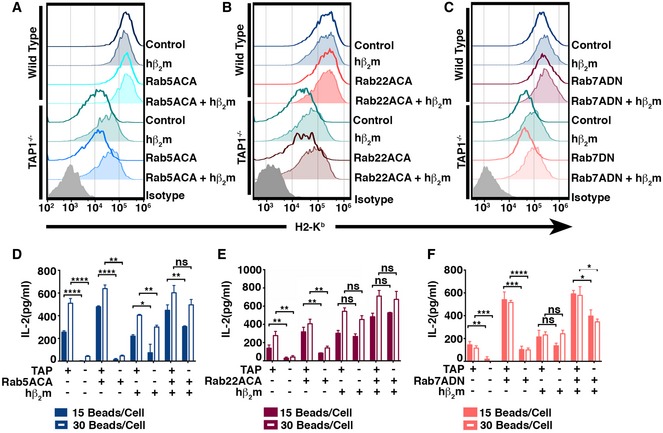
A–C
Surface H2‐Kb levels of wild‐type and TAP1−/− BMDC co‐expressing Rab mutants and hβ2m were analyzed by flow cytometry.
-
D–F
Cross‐presentation of OVA by wild‐type and TAP1−/− BMDC co‐expressing Rab mutants and hβ2m was analyzed, and IL‐2 release is shown (D–F).
Data information: In (D–F), representative means (±SD) of at the least three independent experiments per Rab mutants setup in triplicate are plotted. *
P < 0.05, **
P < 0.01, ***
P < 0.005, ****
P < 0.001, and “ns” is not significant (Student's
t‐test).

