-
A, B
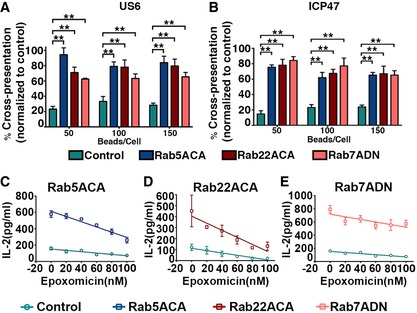
293T‐FcR‐Kb cells co‐expressing empty vector or Rab mutants (Rab5ACA, Rab22ACA, and Rab7ADN) individually, with either LacZ as a control or US6 (A) or ICP47 (B), were analyzed for cross‐presentation of OVA using B3Z cells. The effects of US6 and ICP47 on cross‐presentation were analyzed by plotting the mean percentage of IL‐2 release by cells co‐expressing US6 (A) or ICP47 (B) with control vector or Rab mutants compared to cells co‐expressing LacZ with control vector or Rab mutants, respectively.
-
C–E
293T‐FcR‐Kb cells expressing Rab5ACA (C), Rab22ACA (D), and Rab7ADN (E) were incubated with opsonized OVA‐coated latex beads in the presence of varying doses of epoxomicin. After 6 h, the cells were fixed and incubated with B3Z cells, and IL‐2 production was measured.
Data information: In (A) and (B), means (±SEM) of three independent experiments for each Rab mutants are plotted. **
P < 0.01 (Student's
t‐test). Representative experiments of three independent experiments are shown for each Rab mutants (C–E). The means (±SD) of assay triplicates are plotted. Data were analyzed by performing a linear regression analysis.

