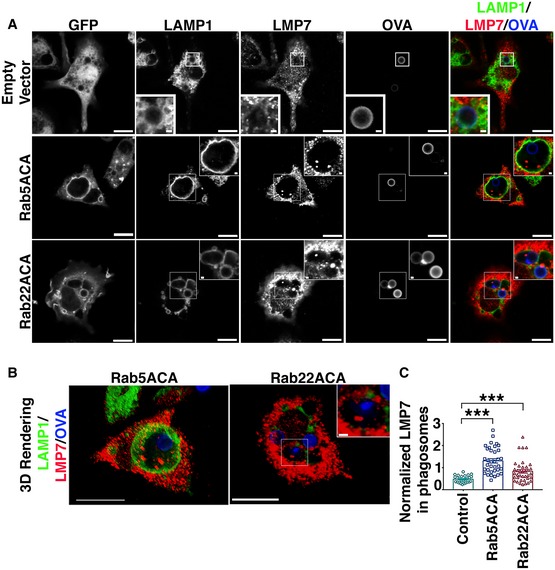
Figure EV4. Immunofluorescence analysis of localization of immunoproteasome subunit, LMP7, with respect to phagosomal lumen.

-
A, BBMDCs expressing GFP, GFP‐Rab5ACA, or GFP‐Rab22ACA were stained for LMP7 and LAMP1, and analyzed by confocal microscopy (A, B), 4 h after uptake of Alexa 647‐OVA‐coated bead. A single optical section (A) and a 3D‐rendering (B) of 10 optical sections of a representative cell are shown (Bar 10 μm). White rectangle boxes marking the regions of interest containing LAMP1‐positive vacuole containing beads coated with Alexa 647‐conjugated OVA are magnified as inset (Scale bars = 1 μm).
-
CThe same cells were analyzed for LMP7 fluorescence intensity within the phagosomal lumen as defined by a region of interest positive for Alexa 647‐OVA enclosed within a limiting membrane positive for LAMP1. The fluorescence intensity of LMP7 within the phagosomal lumen normalized to Alexa 647‐OVA was calculated, and the data from 3 (n = 3) independent experiments were compiled and plotted (C). At the least 28 transduced BMDC, cells were analyzed for each transduction and each cell is represented as a data point.
