-
A
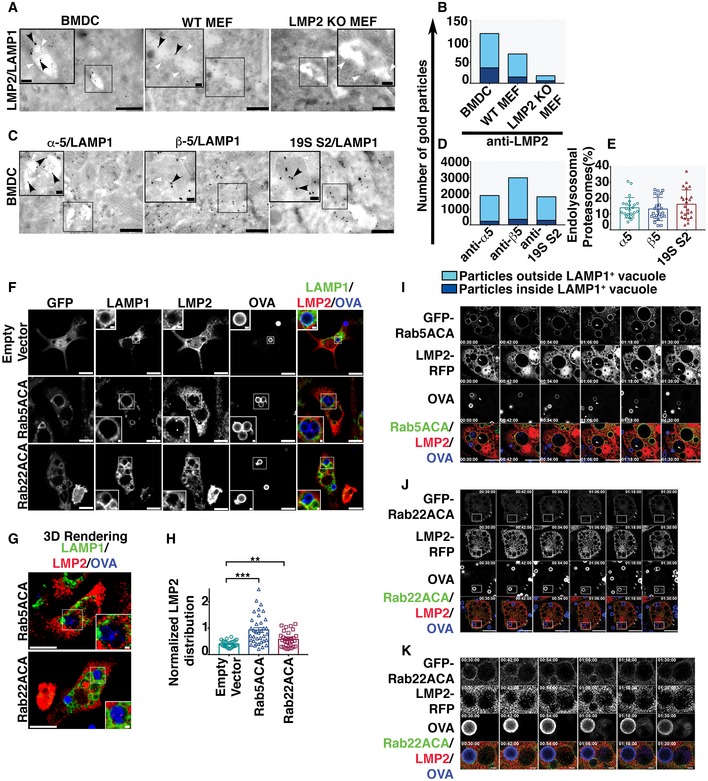
EM micrographs of double immuno‐gold labeling using antibodies against immunoproteasome subunit LMP2 and the endolysosomal membrane marker LAMP1 in BMDC, WT MEF, and LMP2 KO MEF. Large gold particles (15 nm, black arrowhead) label LMP2 and small gold particles label LAMP1 (5 nm, white arrowhead; Scale bars = 500 nm). The insets are the magnification of region of interest containing LAMP1‐positive vacuole (Scale bars = 100 nm), marked by the black rectangle.
-
B
The distribution of LMP2‐positive signals (n = 22 images) assessed by plotting the number of gold particles labeling LMP2 within the LAMP1‐positive membrane compartment versus those outside the LAMP1‐positive organelles.
-
C
Immuno‐gold labeling with antibodies against constitutive proteasome subunits, α5, β5, and 19 S2 (15 nm, black arrowhead), co‐labeled with an anti‐LAMP1 antibody (5 nm, white arrowhead) in BMDC (Scale bars = 500 nm). Regions of interest containing LAMP1‐positive vacuoles are marked by the black rectangles and magnified in the insets (Scale bars = 100 nm).
-
D, E
Immuno‐electron microscopy images (n = 23) were analyzed by plotting the total number of gold particles labeling proteasome subunits inside and outside the LAMP1‐positive membrane compartments (D). These data are also presented as the percentage of the total gold particles that are within the LAMP1‐positive organelle (E).
-
F, G
BMDC transduced with genes encoding GFP, GFP‐Rab5ACA, and GFP‐Rab22ACA under the control of an inducible promoter were fixed and stained for LMP2 and LAMP1 and analyzed by confocal microscopy (F, G) 24 h after doxycycline induction and 4 h after Alexa 647‐OVA‐coated bead uptake. A single optical section (F) and the 3D‐rendering (G) of 10 optical sections of a representative cell are shown (Scale Bar 10 μm). Region of interest containing LAMP1‐positive vacuole containing beads coated with Alexa 647‐conjugated OVA, marked by white rectangles, is magnified as inset (Scale bars = 1 μm).
-
H
The same cells were analyzed for LMP2 fluorescence intensity within the phagosomal lumen as defined by a region of interest positive for Alexa 647‐OVA enclosed within a limiting membrane positive for LAMP1. The fluorescence intensity of LMP2 within the phagosomal lumen normalized to Alexa 647‐OVA was calculated, and data compiled from independent experiments (n = 3) are plotted (H). For each transduced cell type, images of at the least 27 cells acquired across three independent experiments were analyzed and each cell is represented as a data point.
-
I–K
BMDC co‐expressing LMP2‐RFP and GFP‐Rab5ACA (I) or GFP‐Rab22ACA (J, K) were live imaged 16 h after doxycycline induction and 30 min after uptake of Alexa 647‐coated latex beads (Bar 10 μm). Images were acquired every 3 min, and images taken at 12‐min interval are presented (I–K). The arrowheads in panel (I and J) mark the phagosome or vacuoles containing LMP2, respectively. The boxed region in panel (J) marks a phagosome that has been enlarged in panel (K) (Bar 1 μm).
Data information: In (E), the mean (±SD) is plotted and individual data points represent analysis of an individual image. In (H), the means (±SD) are plotted. Individual circles represent analysis of individual cells. ***
‐test).

