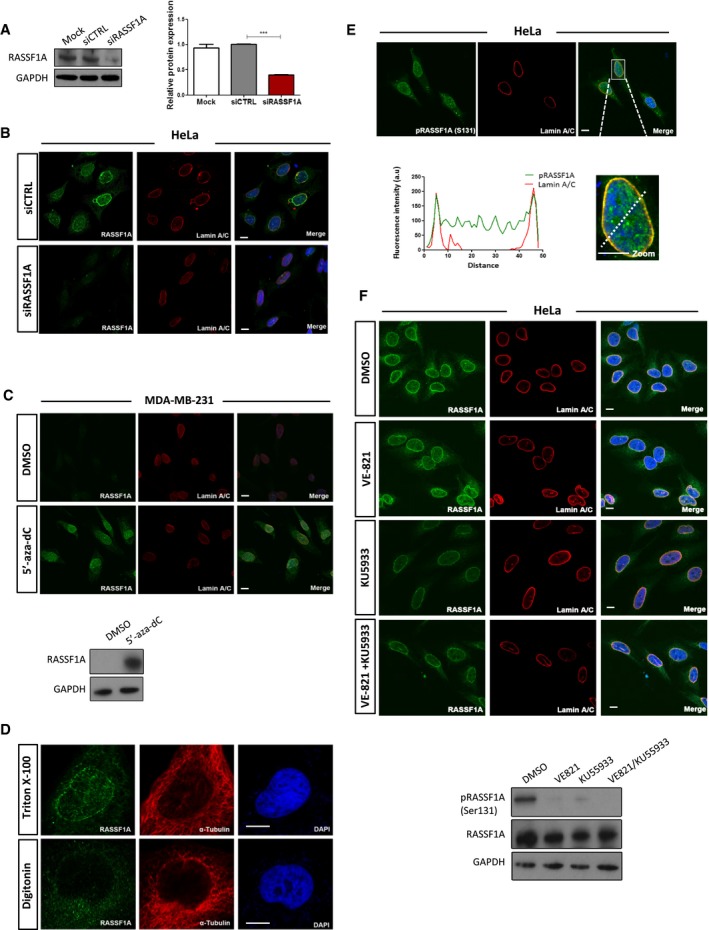
Figure EV1. NE localisation of RASSF1A does not dependent on ATR/ATM kinases.

- Assessment of RASSF1A protein levels in HeLa cells transfected with siRASSF1A. Error bars derive from two independent experiments and represent the SEM.
- Representative confocal images of RASSF1A and Lamin A/C in siRASSF1A‐transfected HeLa cells. DNA was stained with DAPI. Scale bars = 10 μm.
- Immunofluorescence images of RASSF1A in MDA‐MB‐231 cells after treatment with DMSO or 5′‐aza‐dC demethylating reagent. DNA was stained with DAPI. Lower blot shows the expression levels of RASSF1A levels following treatment. Scale bars = 10 μm.
- Digitonin‐permeabilised HeLa cells stained with RASSF1A and the cytoplasmic α‐tubulin as a marker of plasma membrane permeabilisation. DNA was stained with DAPI. Scale bars = 10 μm.
- Immunofluorescence detection of phosphorylated RASSF1A (Ser 131). Fluorescence intensity profile of Lamin A/C (red) and pRASSF1A (Ser 131) (green) signals across the HeLa nuclei. Position of line scan indicated by the dashed white line. Scale bars = 10 μm.
- Immunofluorescence images of RASSF1A in HeLa cells treated with DMSO, ATR inhibitor VE821, ATM inhibitor KU5933 and the combination of both. Western blot (bottom) of RASSF1A protein levels following the corresponding treatments. Scale bars = 10 μm.
