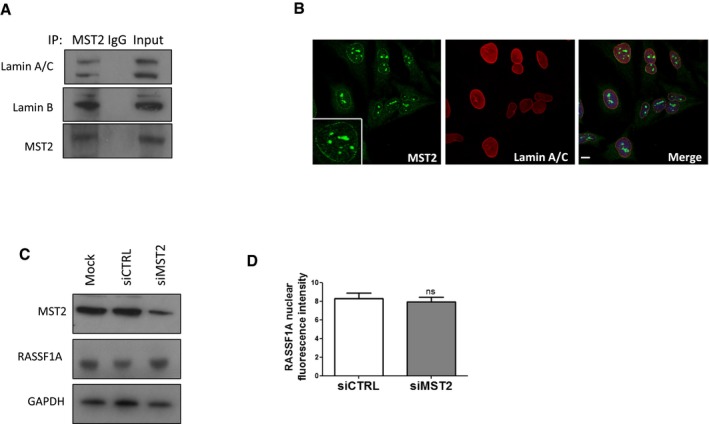
Figure EV2. MST2 binds to Lamins A/C and B.

- Co‐immunoprecipitation of endogenous MST2 with Lamin B and Lamin A/C.
- Immunofluorescence images of RASSF1A and MST2 (ab52641). Scale bars = 10 μm.
- Western blot analysis of MST2 and RASSF1A protein levels in siMST2‐transfected cells.
- Quantification of nuclear fluorescence intensity of RASSF1A in siMST2‐transfected cells. Fluorescence intensity was quantified in 50–100 cells. Error bars derive from three independent experiments and represent the SEM.
