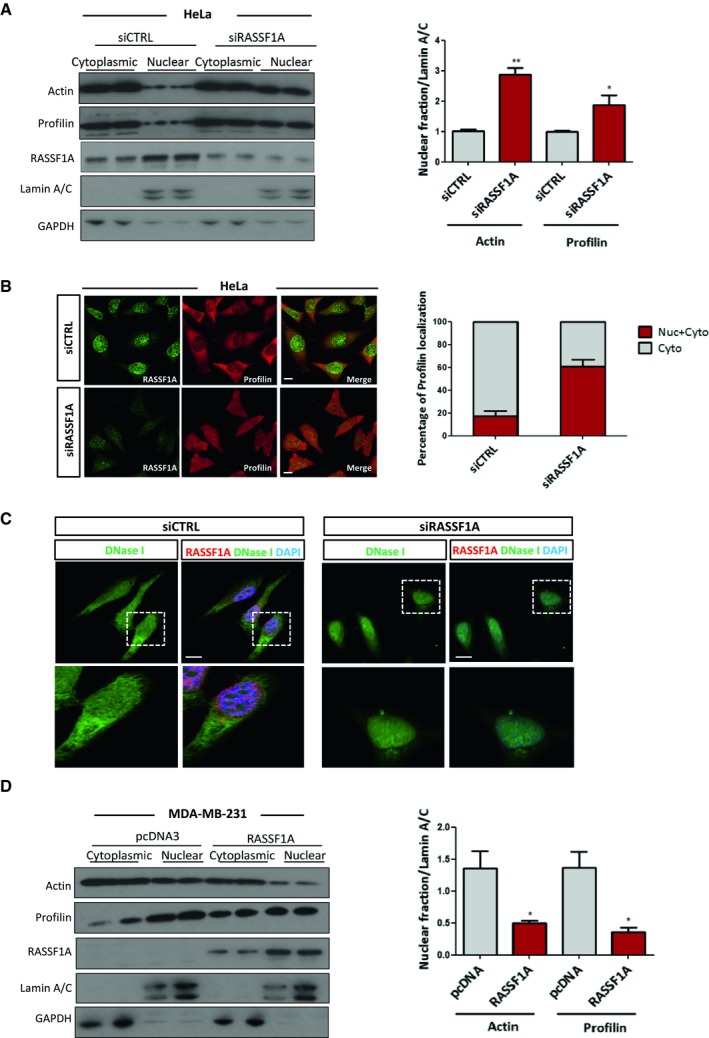
Figure 4. RASSF1A is involved in actin and profilin nuclear export process.

- HeLa cells treated with control or RASSF1A siRNA were fractionated into cytoplasmic and nuclear extracts. Lysates from each fraction were probed for actin and profilin alongside GAPDH (as a marker of the cytoplasmic fraction) and Lamin A/C (as a marker of the nuclear fraction). Right: quantification of nuclear actin and profilin relative to Lamin A/C is shown. Error bars derive from two independent experiments and represent the SEM.
- Immunofluorescence images of profilin in control and RASSF1A siRNA‐transfected HeLa cells. Right: the profilin localisation was scored as nuclear/cytoplasmic or predominantly cytoplasmic in approximately 100 cells. Error bars derive from three independent experiments and represent the SEM.
- Confocal images of endogenous monomeric globular actin (G‐actin) in siCTRL and siRASSF1A cells using DNase I staining (Alexa Fluor 488‐conjugated, green). Scale bars = 10 μm.
- Western blot analysis of actin, profilin, GAPDH and Lamin A/C levels in nuclear and cytoplasmic fractions of MDA‐MB‐231 cells treated with control pcDNA3 or RASSF1A vector. The graph shows the nuclear levels of actin and profilin relative to Lamin A/C in MDA‐MB‐231 cells expressing RASSF1A. Error bars derive from two independent experiments and represent the SEM.
