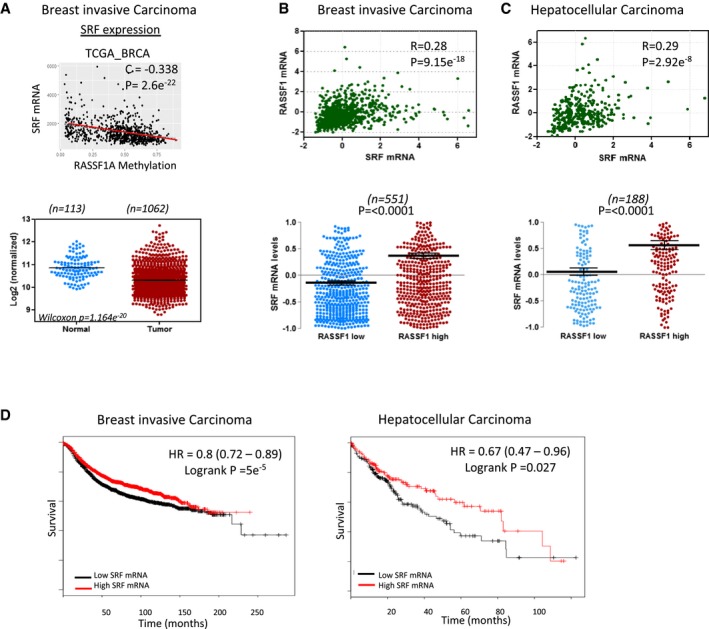
Figure 6. Correlation of RASSF1 and SRF expression in human tumours.

- Upper: scatter plot of RASSF1 methylation levels to SRF mRNA expression in breast invasive carcinoma (TCGA, Provisional, n = 960). Lower: SRF expression (TCGA, Illumina HiSeq RNA Seq) in normal and BRCA patients.
- Upper: scatter plot of RASSF1 mRNA to SRF mRNA levels in breast invasive carcinoma (TCGA, Provisional, n = 960). Values are given in (RNA Seq V2 RSEM). Lower: differences in SRF mRNA expression of samples that express low and high levels of RASSF1 mRNA.
- Upper: scatter plot of RASSF1 mRNA to SRF mRNA levels in hepatocellular carcinoma (TCGA, Provisional, n = 360 samples). Values are given in (RNA Seq V2 RSEM). Lower: differences in SRF mRNA expression of samples that express low and high levels of RASSF1 mRNA.
- Survival analysis of BRCA (n = 3,951) and HCC (n = 364) patient samples estimated by Kaplan–Meier survival curve with high (red) and low (black) expression of SRF.
