
Figure EV2. The analysis of histone sumoylation in mutants.
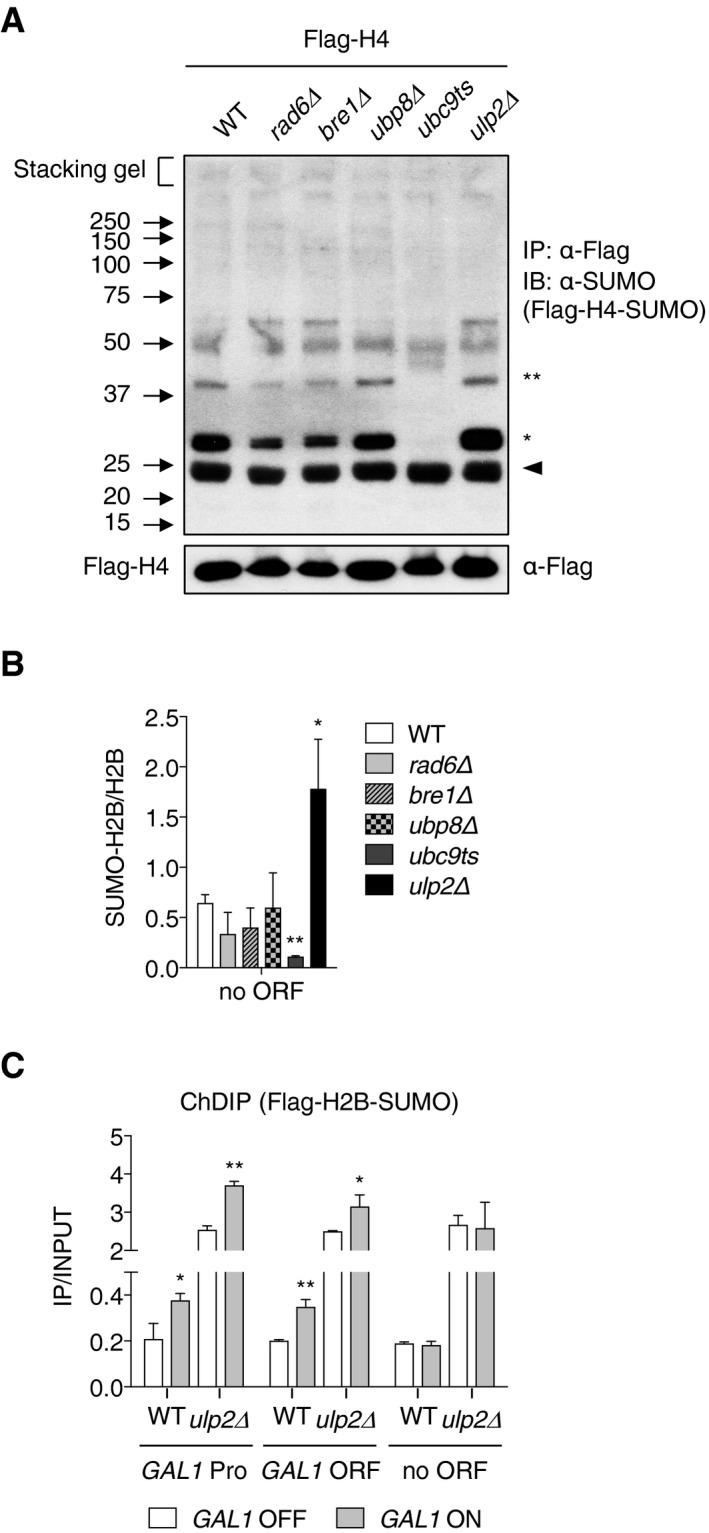
- Immunoblot analysis of immunoprecipitated Flag‐tagged histone H4 using anti‐SUMO antibodies in the indicated mutants, as described in Fig 4A. The upper and lower panels show Flag‐H4‐SUMO and Flag‐H4 (loading control), respectively. One and two asterisks indicate mono‐ and di‐sumoylated histones (upper panel), respectively, and the arrowhead represents a non‐specific band.
- ChDIP of Flag‐H2B‐SUMO in the indicated strains at a nontranscribed site (“no ORF”) as in Fig 6D. Error bars indicate the SD from three independent assays.
- ChDIP of Flag‐H2B‐SUMO in WT and ulp2Δ strains during GAL1 gene induction, described as in Fig 5D. For GAL1 induction, cells grown in SD‐Trp medium with 2% glucose were shifted to SD‐Trp medium containing 2% raffinose. After 2 h, the medium was replaced with SD‐Trp medium containing 2% galactose and then incubated for 1 h. GAL1 OFF and ON indicate uninduced and induced conditions, respectively. The error bars represent the SD from three ChDIP assays.