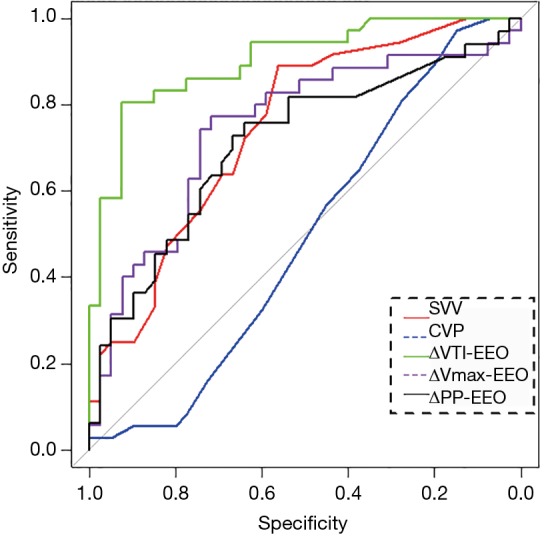
Figure 2.

Comparison of the areas under the ROC curves for the indicators used for predicting fluid responsiveness. ROC, receiver operating characteristics; SVV, stroke volume variation; CVP, central venous pressure; ΔVTI-EEO, percentage change in VTI induced by EEO maneuver; ΔVmax-EEO, percentage change in Vmax induced by EEO maneuver; ΔPP-EEO, percentage change in pulse pressure induced by EEO maneuver.
