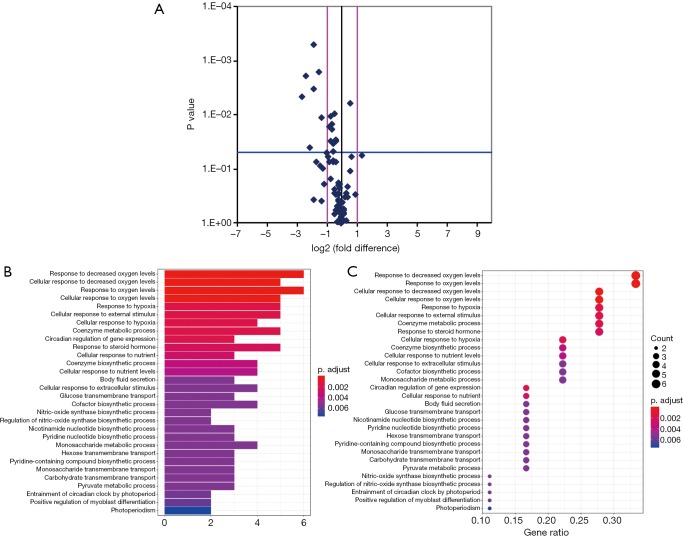
Figure 1.
Volcano plot of significantly differential experiment genes and significant gene ontology (GO) analyses and pathways of differentially expressed genes. (A) Analyzing the differentially expressed genes by t-test, log2 (fold change) was taken as abscissa and negative logarithm-log10 (P value) of P value was taken as ordinate. (B) The significant GO of differentially expressed genes. (C) The significant function of differentially expressed genes. The y axis shows the GO or pathway category and the x axis shows the negative logarithm of the P value (–LgP). A larger –LgP indicated a smaller P value for the difference.

