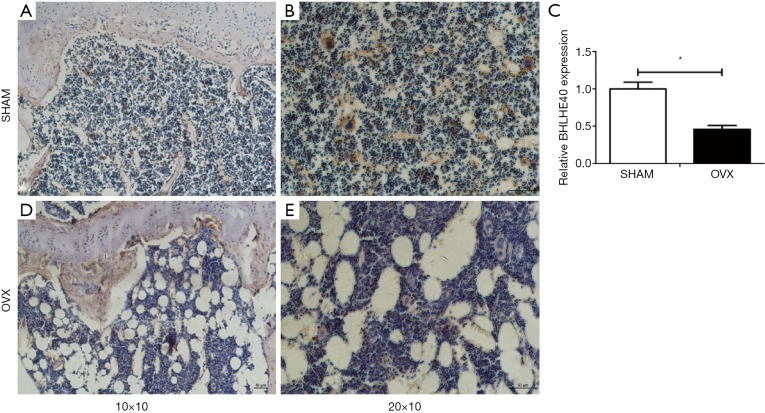
Figure 5.
Expression of Bhlhe40 of SHAM and OVX mice by immunohistochemistry. (A) Expression of Bhlhe40 of SHAM mice (10×10); (B) expression of Bhlhe40 of SHAM mice (20×10); (D) expression of Bhlhe40 of OVX mice (10×10); (E) expression of Bhlhe40 of OVX mice (20×10); (C) relative expression of Bhlhe40 between two groups. All experiments in this figure were repeated at least three times, and data were expressed as mean ± SD. *, P<0.05 compared with SHAM group.

