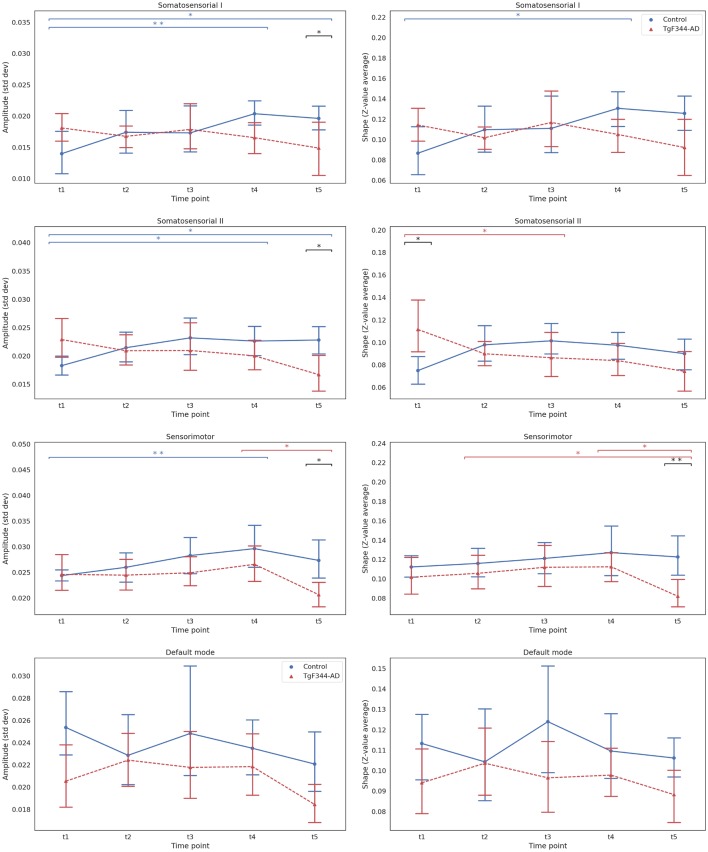
Figure 2.
Mean and 95% confidence interval showing the evolution with time of the amplitude (left column) and the shape (right column) for each group and time point for the four selected independent components. **Indicates significant difference (pFDR < 0.05), *a tendency to differences (pFDR < 0.1) between groups or time points connected by the line under it. Blue for the wild type (WT) group and red for the TgF344-Alzheimer’s disease (AD) group, black lines for the differences between groups.

