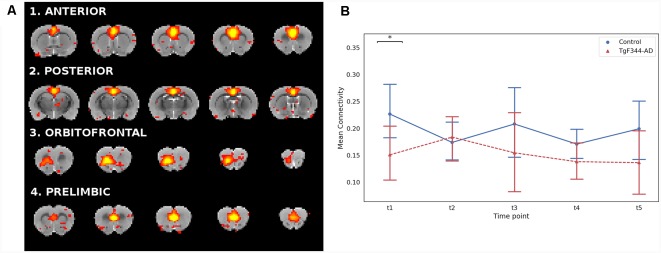
Figure 3.
(A) Coronal slices of the rat brain for the four DMN subnetworks (Z > 2.3). Each component is represented with its most representative five slices. The color scale and the anatomical reference are the same as in Figure 1. (B) Mean connectivity and 95% confidence interval within the DMN for each group and each time point. *Indicates significant difference (p < 0.05) between groups . Blue lines for the WT group and red for the TgF344-AD group.

