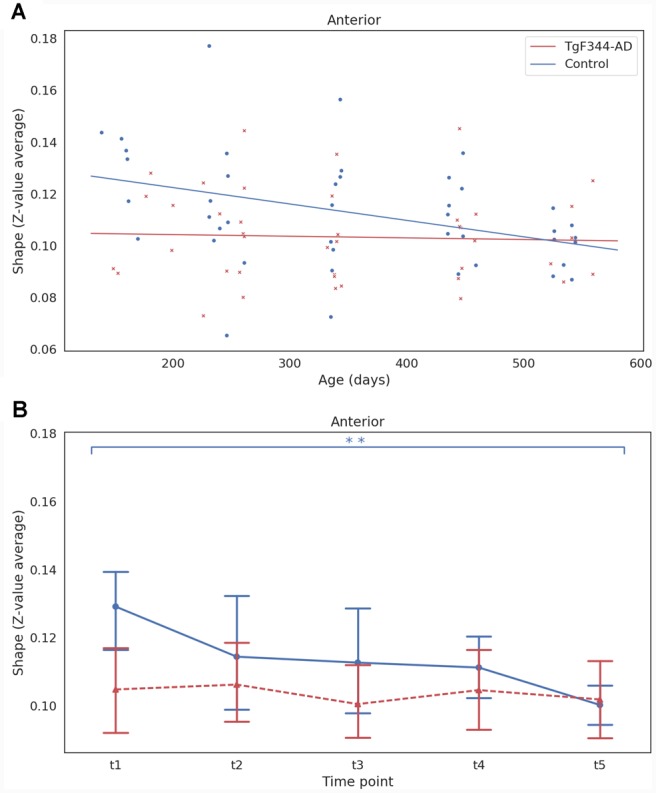
Figure 4.

(A) Linear mixed effect (LME) model fit of the shape as function of age and group for the anterior DMN subnetwork. Each dot represents the shape of one animal at one time point. (B) Mean and 95% confidence interval showing the evolution with time of the shape for each group and time point for the anterior DMN subnetwork. **Indicates significant difference (pFDR < 0.05) between groups or time points connected by the line under it. Blue for the WT group and red for the TgF344-AD group.
