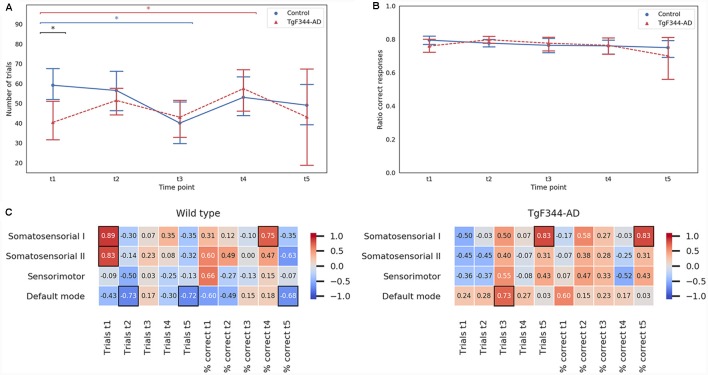
Figure 5.
Mean and 95% confidence interval for (A) the number of trials and (B) the ratio of correct responses in the delayed non match-to-sample (DNMS) task performed by both control and TgF344-AD groups at the five time-points. *Indicates significant difference (p < 0.05) between groups connected by the line under it. Blue lines for the WT group and red for the TgF344-AD group. (C) Spearman correlation coefficients between each network amplitude and the number of trials and ratio of correct responses of the DNMS test at the five time-points for the control (right column) and the TgF344-AD (left column) groups. Black boxes indicate significant Spearman correlation (p < 0.05).

