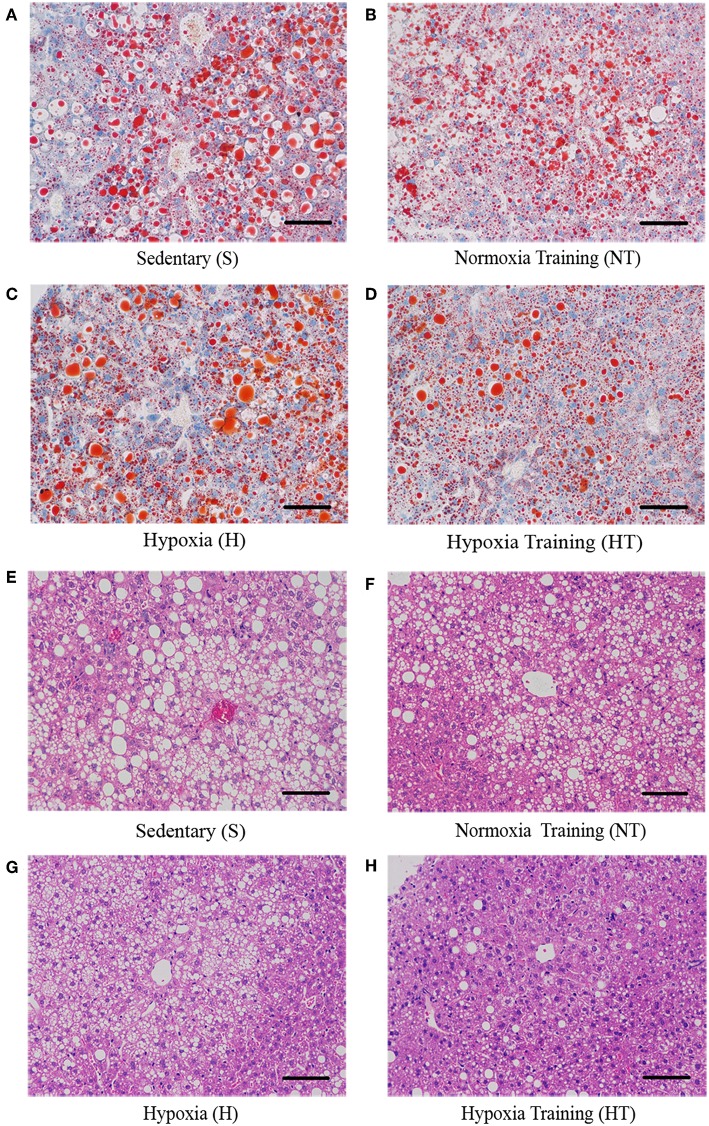
Figure 4.
Effect of hypoxic training on the level of lipid droplets in mice liver sections. Representative figures of liver Oil Red O Staining from respectively mice in each group (A–D). Representative figures of liver hematoxylin-eosin staining from respectively mice in each group (E–H). Scale bar: 50 um.

