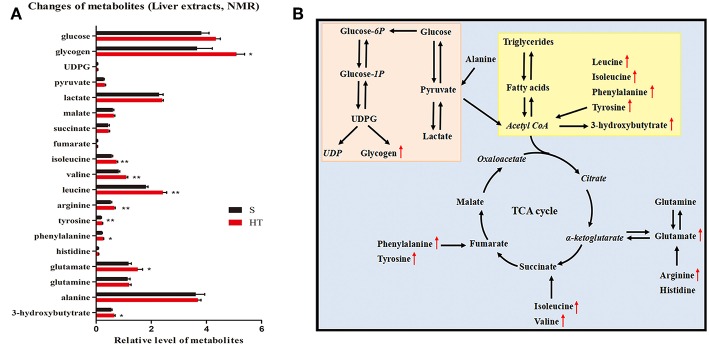
Figure 5.
Effects of hypoxic training on glucose and lipid metabolism. Changes of metabolites in response to hypoxic training in mice (A). Data are shown as mean ± SEM, n = 8, *p < 0.05, **p < 0.01. (B) Summary of metabolic pathways associated with hypoxia training intervention. The italic metabolite represents the undetected metabolite, and the red font is the significantly increased metabolite of Group D vs. Group A. The pink box is glucose metabolism pathway, and the yellow box is lipid metabolism pathway.

