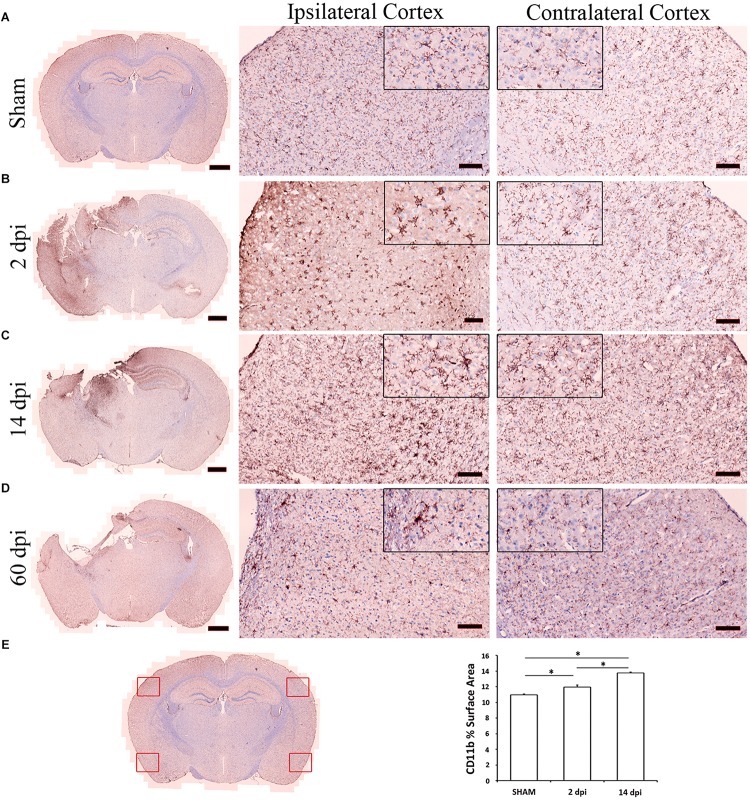
FIGURE 1.
Microglia activation after controlled cortical impact (CCI). Microglia were labeled with anti-CD11b antibody. This figure shows representative photomicrographs of cortical microglia taken from contralateral and ipsilateral hemispheres from sham (A), 2 (B), 14 (C), 60 (D) days post-injury (dpi). The left column illustrates the distribution of microglia activation at low magnification. Compared to the uninjured sham (A), increased CD11b staining is observed across the cortex at 2 (B) and 14 dpi (C). Highly ramified microglia with spherical cell bodies in sham animals become less ramified with swollen or stretched cell bodies by 2 and 14 dpi (see magnified 20 μm corner views). Images are representative of three animals per time point. Scale bars are 1 mm, 100 μm, and 20 μm for photomicrographs on increasing magnification. (E) Scanned photomicrograph was used to produce four images as representative of each hemisphere and two from the contralateral hemisphere. CD11b surface area was analyzed using ImageJ software and quantification data are shown as mean ± SEM differences in CD11b surface area between region and time post-injury. Compared to the uninjured sham, there is significant increase in CD11b surface area across the cortex at 2 (p = 0.0006) and 14 dpi (p< 2e–16).

