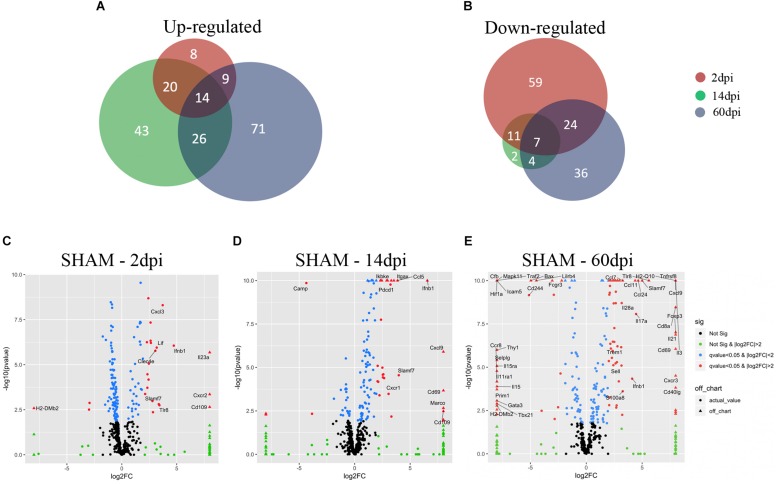
FIGURE 2.
Microglial gene expression after CCI. (A,B) Venn diagrams showing the overlap between 2, 14, and 60 dpi, vs. sham of (A) up-regulated genes (adjusted p-value < 0.05) and (b) down-regulated genes (adjusted p-value < 0.05). (C–E) Volcano plot showing the microglia gene expression of (C) 2 dpi vs. sham, (D) 14 dpi vs. sham, and (E) 60 dpi vs. sham. On the x-axis are the log2-fold changes and the y-axis is the –log10(p-value). Genes in black: False discovery rate (FDR) ≥ 0.05, |log2(FC)| ≤ 2; genes in green: FDR ≥ 0.05, |log2(FC)| > 2; genes in blue: FDR < 0.05, |log2(FC)| ≤ 2; and genes in red: FDR < 0.05, |log2(FC)| > 2. Genes in red with FDR ≤ 0.05, |log2(FC)| > 3 are named.

