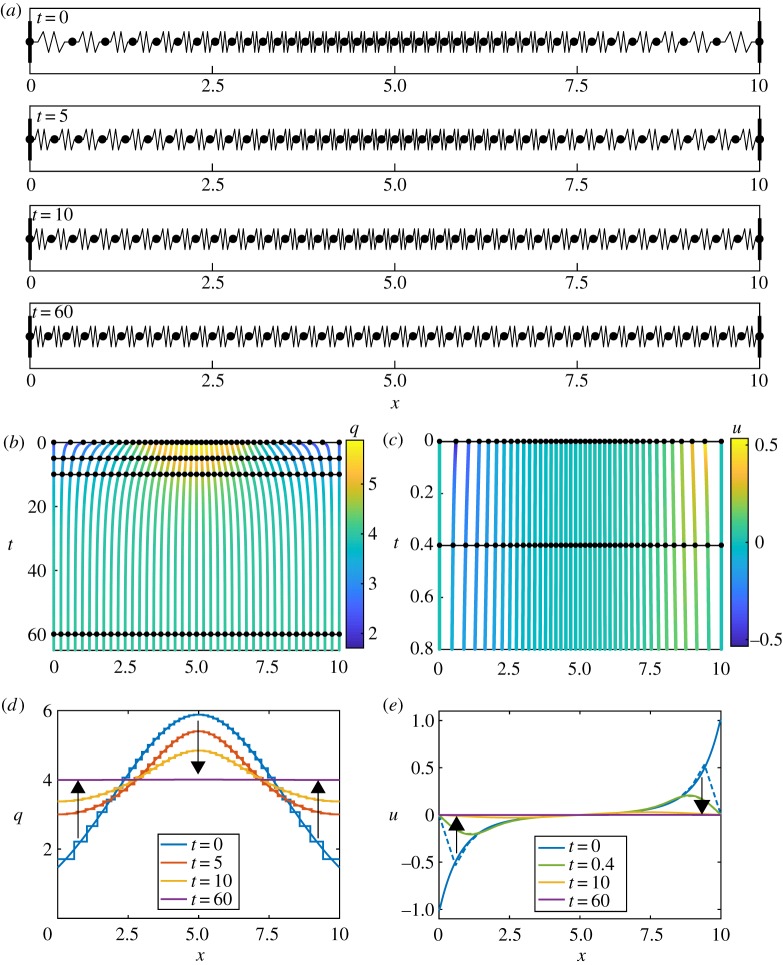
Figure 2.
Results for homogeneous k and a, with N = 40 and m = 1. (a) Snapshots of cell boundary positions and cell lengths at t = 0, 5, 15, 60. (b) Characteristic diagram for cell boundary position evolution for 0 ≤ t ≤ 65. Colour denotes the cell density. Black lines with dots represent snapshots in (a) and (d). (c) Characteristic diagram for cell position evolution for 0 ≤ t ≤ 0.8. Colour denotes velocity. Black lines and dots represent snapshots in (e). (d) Cell density snapshots at t = 0, 5, 10, 60. Results from discrete/continuum system displayed as stepped/solid lines. (e) Velocity snapshots at t = 0, 0.4, 10, 60. Results from discrete simulation and continuum system displayed as dashed/solid lines. Arrows indicate the direction of increasing time. (Online version in colour.)

