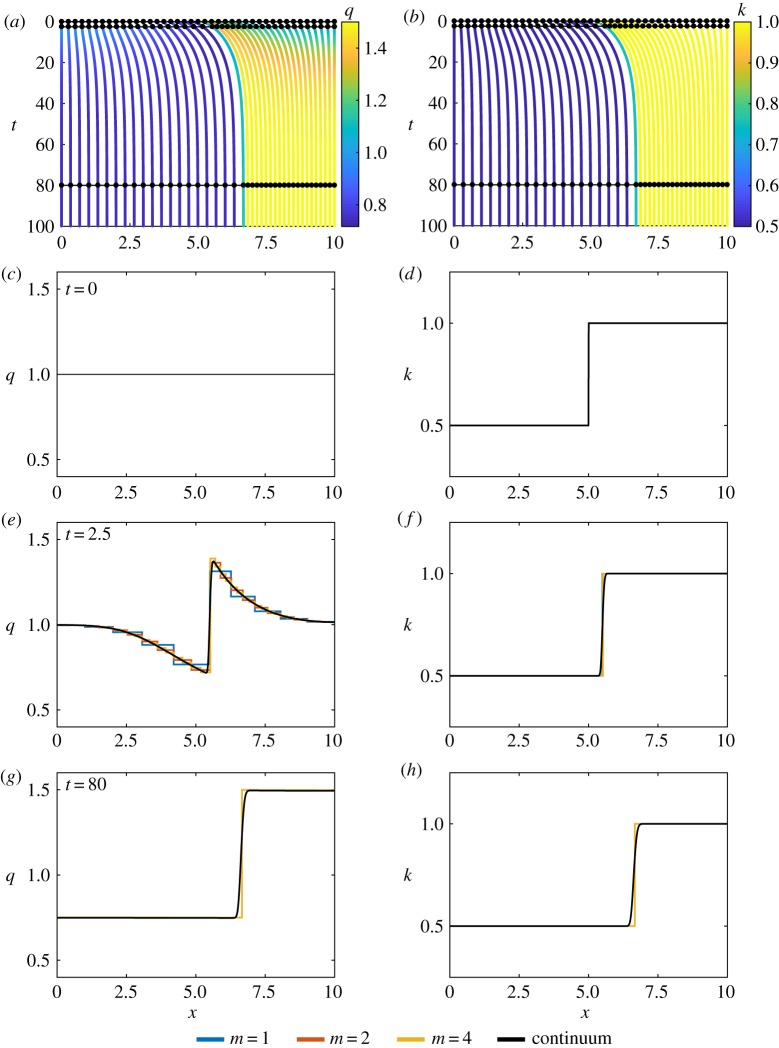
Figure 4.
Results for piecewise constant cell properties, with N = 10. (a,b) Characteristic diagram for spring boundary position evolution for 0 ≤ t ≤ 100, with m = 4 so that every fourth trajectory represents a cell boundary. Colour denotes (a) cell density, (b) cell stiffness. In (a,b), black lines and dots represent times for snapshots in (c–h). (c,e,g) Cell density snapshots at t = 0, 2.5, 80. (d,f ,h) Cell stiffness snapshots at t = 0, 2.5, 80. In (c–h) lines display results from N = 10 with m = 1, 2, 4 and continuum system. (Online version in colour.)

