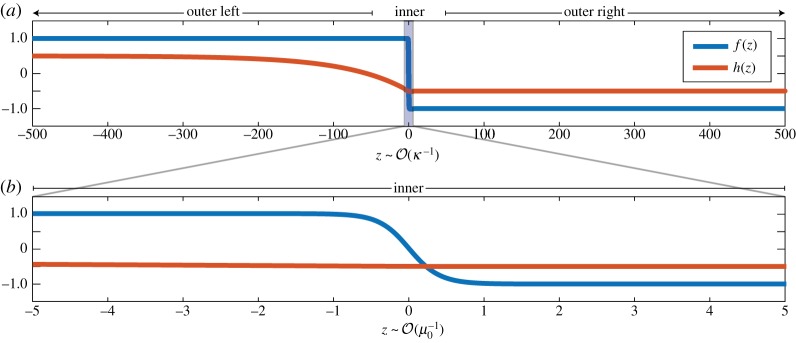
Figure 4.
Approximation of the travelling wave profile using a solution to the continuous model for (a) the displacement function, f(z), and (b) the biological reaction, h(z). Parameters used are ν = 4, η = 2 and κ = 0.01. In (a), the horizontal axis is scaled to show both outer regions where , which is the rate of change of h(z). In (b), the horizontal axis is scaled to show the inner region where , which is the rate of change of f(z). (Online version in colour.)

