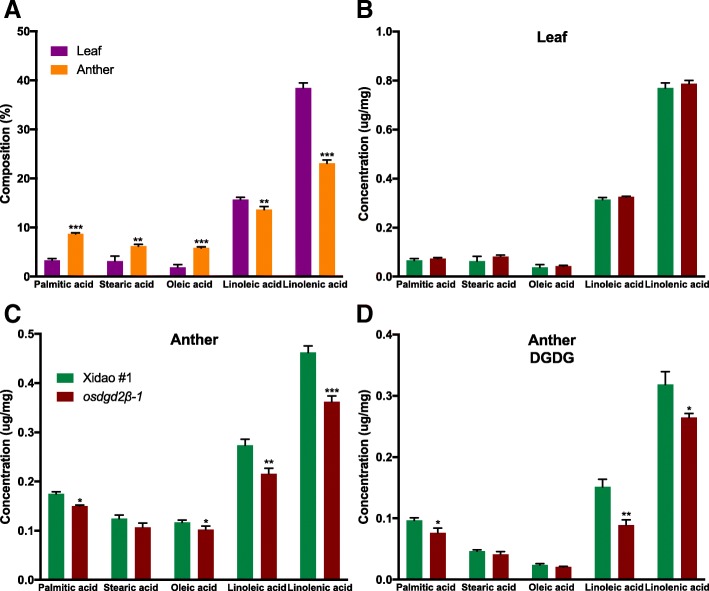
Fig. 4.
Fatty acid composition in leaf and anther of wild-type cultivar Xidao #1 and its mutant osdgd2β-1. a shows the fatty acid composition in leaf (purple) and anther (orange) in weight percentage of wild-type. b & c show concentration of fatty acids in leaf and anther, respectively. d shows concentration of fatty acids in DGDG spot obtained from TLC (refer Additional file 4: Figure S3). All values represent means ± standard deviations. Asterisk represent statistically significant differences (Tukey’s test, * P < 0.05, ** P < 0.01, *** P < 0.001). Fatty acid concentration in b, c and d are measured on the basis of fresh weight of tissue samples

