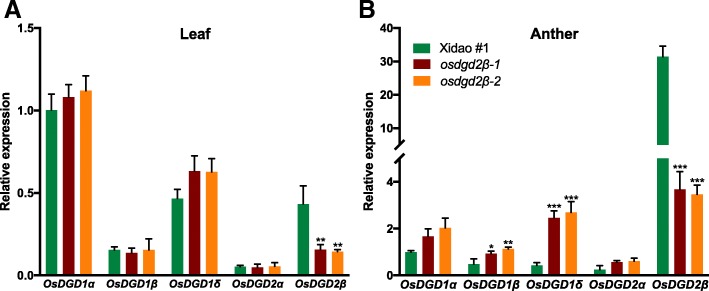
Fig. 6.
Relative gene expression levels of DGDG synthesis genes in leaf (a) and anther (b) of a wild-type cultivar Xidao #1 and its mutants osdgd2β-1 and osdgd2β-2. The expression levels were first normalized to the internal control gene OsACTIN and reported relative to the expression level of OsDGD2β in wild-type (assigned a value of 1). All values represent means ± standard deviations. Asterisk represent statistically significant differences (Tukey’s test, * P < 0.05, ** P < 0.01, *** P < 0.001)

