Fig. 1.
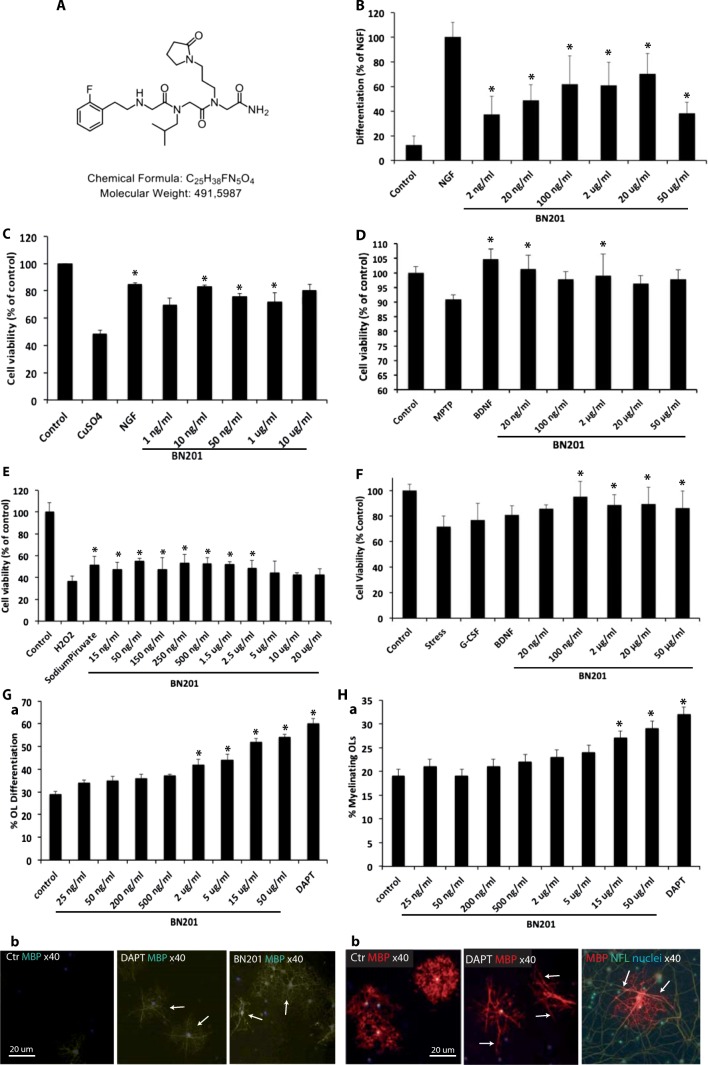
Neuroprotective activities of the small chemical BN201. All assays were done in duplicate wells and repeated twice. We used BN201’s dissolving solution as control (saline). Results are shown as the mean + SEM. A BN201 chemical structure (mw 491 Da). B Differentiation of PC12 cells to a neuronal phenotype expressed as the percentage of cells with neurites compared to the positive control NGF (100 ng/ml). C Survival of the myelin cell line RN22 (MTT assay) in the presence of oxidative stress induced with CuSO4 (150 μM). NGF (100 ng/ml) was used as positive control for promoting Schwann cell survival. D Survival of the human neuroblastoma cell line SH-SY5Y (MTT assay) in the presence of MPTP (100 μM)-induced oxidative stress. BDNF (20 ng/ml) was used as a positive control for promoting neuronal survival. E Survival of SH-SY5Y cells (MTT assay) in the presence of H2O2-induced oxidative stress (100 μM). Sodium pyruvate (10 μM) was used as a positive control for anti-oxidant activity. F Survival of NSC34 cells (MTT assay) under trophic factor deprivation. Positive controls used were the trophic factors G-CSF (2 μg/ml) or BDNF (20 ng/ml). G Differentiation of mice oligodendrocyte precursor cell (OPC) to mature (MBP+) oligodendrocytes (OLs). (a) Graph showing the percentage of mature OLs. (b) Representative micrographs of the MBP staining (arrows) of OPC cultures for placebo, the gamma secretase inhibitor DAPT (1 μM) that promotes OPC differentiation, and BN201 (100 μM). (H) Percentage of myelinated axons in the presence of increasing concentrations of BN201 or positive control (1 μM DAPT in duplicate). Dose selection of positive controls is described in the methods. (a) The graph shows the quantification of the assays. (b) The microphotograph shows a representative picture of the co-cultures of differentiated RGCs and OPCs, showing myelin (MBP+) in red, axons (neurofilaments, NFL) in green, and nuclei (DAPI) in blue. Arrows indicate representative linear MBP+ structures quantified in the analysis. Comparisons between groups were done using ANOVA test, with Tukey post hoc analysis. *p < 0.05 with respect to stressed control

