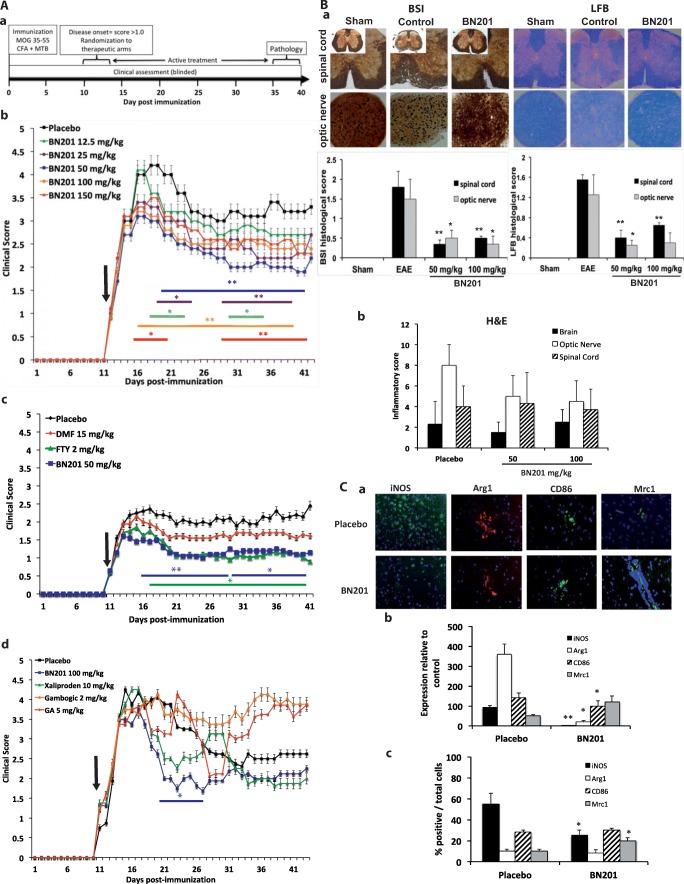
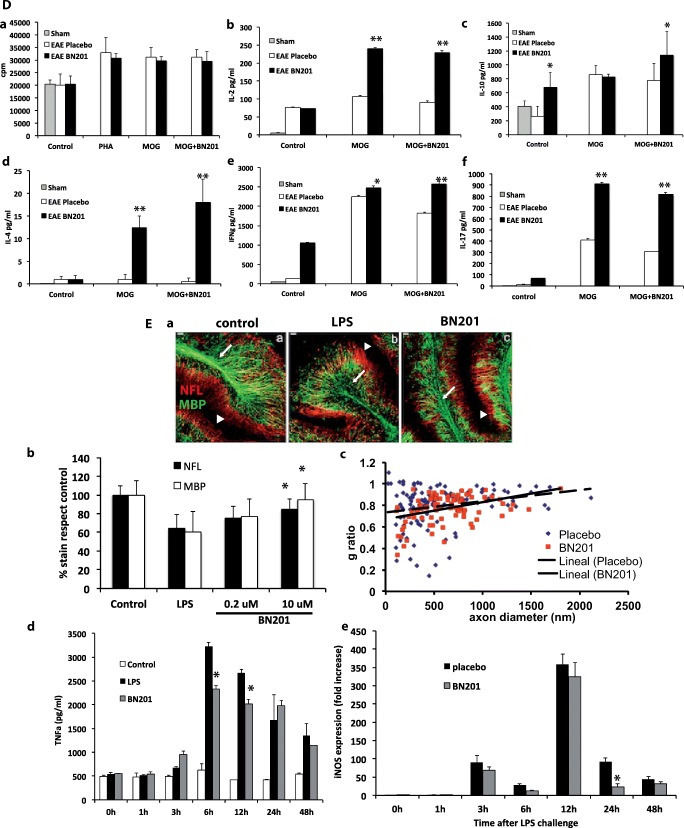
Fig. 3.
In vivo effects of BN201 in animal models of neuroinflammation. (A–C–D) Experimental autoimmune encephalitis (EAE) was induced in C57BL6 mice immunized with MOG35-55. Animals were treated after disease onset after randomization and scores were collected blinded. Dose selection is indicated in the methods and the placebo was the BN201’s dissolving solution (5% DMSO in saline). Results are representative from 2 experiments comprising 10 animals per group for each study. Results are shown as the mean of the clinical score per day. Arrow indicates the day therapy started. Lines in color indicate the days the clinical score was significantly different with respect to the placebo group (Mann–Whitney test day by day, *p < 0.05; **p < 0.01). A EAE curative trials: (a) study design; (b) clinical score (mean and SEM) in animals treated with increasing doses of BN201 (12.5, 25, 50, 100, 150 mg/kg, i.p.); (c) compared with immunomodulatory drugs fingolimod (FTY, 2 mg/kg) and dimethyl fumarate (DMF, 15 mg/kg); (d) compared with the neurotrophin mimetics xaliproden (910 mg/kg), gambogic acid (2 mg/kg), and glatiramer acetate (GA 5 mg/kg). B Histological analysis of the effects of BN201 in the EAE model by the end of the follow-up (day 30 after randomization): (a) 3 animals per group were analyzed at the levels of the optic nerve and spinal cord assessing axonal density with the Bielschowsky’s silver impregnation (BSI) and myelin preservation with the Luxol fast blue stain (LFB); (b) inflammatory infiltrates by hematoxylin–eosin stain (H&E). Graphs show the histological score in the sham (nonimmunized), placebo (EAE), and animals treated with BN201 (50 and 100 mg/kg). C Microglia profile in the brain of EAE animals treated with BN201 was assessed at the end of the experiment, by quantifying gene expression and protein levels for iNOS, CD86, arginase, and the mannose receptor (Mrc1 or CD206). (a) Representative microphotograhs of the immunofluorescence stains; (b) mRNA levels by PCR; (c) protein levels by Western blot as the percentage of cells expressing the protein. Results are shown as the mean + SEM and a representative image of protein immunostaining. D Peripheral immune response in EAE animals treated with BN201 from the experiment shown in (Aa). Graphs shows (a) cell proliferation (counts per million (cpm)) and cytokine levels of (b) IL-2, (c) IL-10, (d) IL-4, (e) IFNγ, and (f) IL-17. Assays were carried out in splenocytes obtained by day 12 after immunization from animals suffering EAE and treated with placebo (EAE placebo) or BN201 100 μg/ml/day (EAE BN201). Sham indicates assays from nonimmunized animals. Splenocytes were restimulated in vitro with MOG35-55 alone or combined with BN201 100 μM or saline (control). Results are shown as the mean + SEM. Statistical significance refers to BN201-treated animals compared with placebo EAE animals; *p < 0.05; **p < 0.01. E Effects of BN201 in the in vitro model of neuroinflammation using cerebellar cultures challenged with LPS. Experiments were performed twice. (a) Culture microphotographs treated with BN201 (10 μM) showed less demyelination (MBP stain) and axonal loss (NFL stain) than placebo; (b) quantification of cerebellar culture demyelination (MBP stain) and axonal loss (NFL stain); (c) g-ratios of individual axons as a function of axonal diameter (g-ratios were analyzed from transmission electron microscopic images) in placebo and BN201-treated cultures. Cultures challenged with LPS and treated with BN201 showed lower levels of: (d) TNFα measured by ELISA or (e) iNOS gene expression measured by PCR, than placebo (LPS group). *p < 0.05


