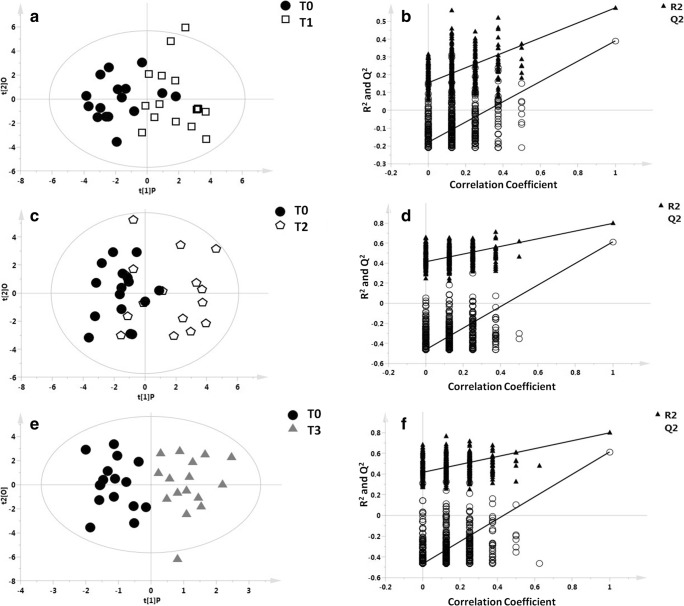
Fig. 1.
OPLS-DA models with the respective permutation tests obtained by comparing T0 vs T1, T0 vs T2, and T0 vs T3 samples for each patient. Blood samples were collected at baseline (T0) and then at 6 (T1), 12 (T2), and 24 (T3) months of IFN ß treatment. OPLS-DA models with the respective permutation test indicated a differential distribution of the T0 vs T1 sample (A, B), R2X = 0.697, R2Y = 0.576, Q2 = 0.391, p = 0.006); T0 vs T2 sample (C, D), R2X = 0.725, R2Y = 0.450, Q2 = 0.247, p = 0.09); and T0 vs T3 sample (E, F), R2X = 0.812, R2Y = 0.797, Q2 = 0.613, p = 0.003)

