
Fig. 2.
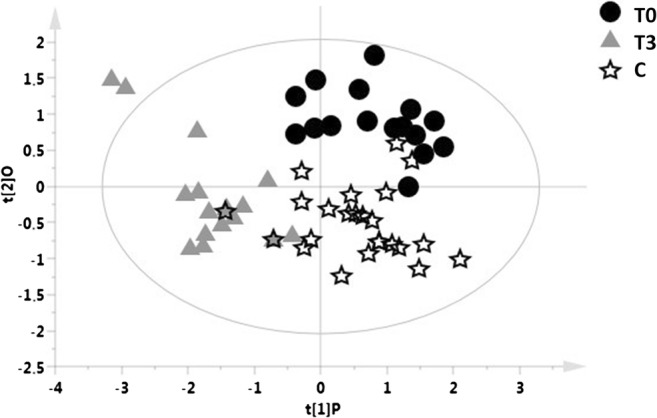
OPLS-DA model with 3 classes, including the T0 and T3 samples of each patient and the samples from healthy controls. The blood samples included in the OPLS-DA model were collected at baseline (T0) and 24 months (T3) of IFN ß treatment. OPLS-DA model of T0 (black circles) and T3 samples (gray triangles) of each patient and control group (white stars) is reported (R2X = 0.615, R2Y = 0.598, Q2 = 0.149, p = 0.1)