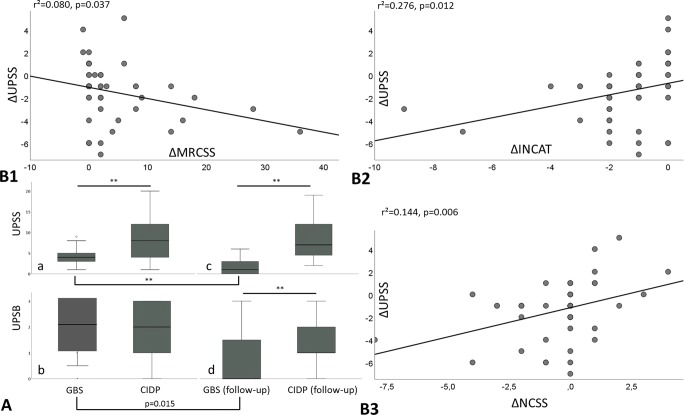
Fig. 1.
Overall UPSS data at onset (A, a) with significant larger values in CIDP (asterisk symbol) compared to GBS, whereas the UPSB (A, b) is not significantly different. In contrast, after 6 months, both scores are significantly larger in CIDP (A, c and d). Figure B shows the correlation of all CIDP and GBS patients` changes (Δ) of MRCSS (B1), the INCAT overall disability score (B2), and the NCSS (B3) with the ΔUPSS, which correlate all significantly. Patients with the same (Δ)s are summarized as one dot for clarity

