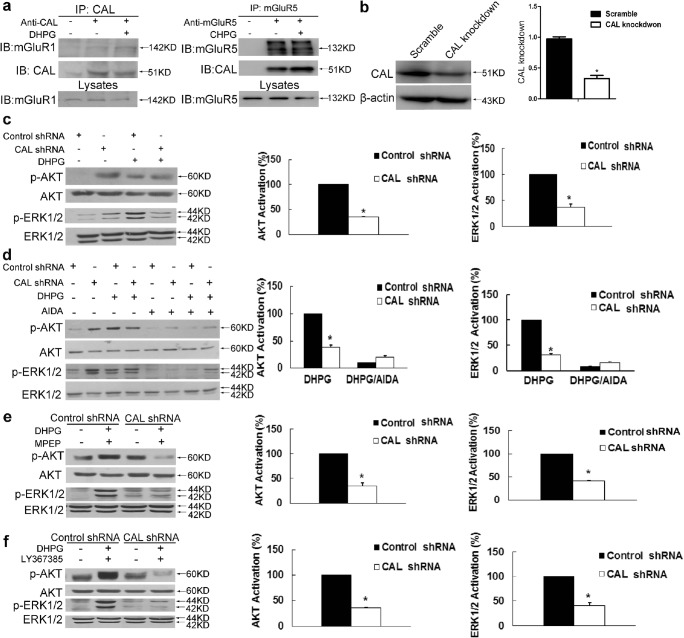
Fig. 1.
CAL modulates group I mGluRs-mediated AKT and ERK1/2 signaling in C6 astroglial cells. (A) Cells were treated with DHPG for 30 min followed by coimmunoprecipitation. The cell lysates were incubated with anti-CAL (left) or anti-mGluR5 (right) antibody coupled to protein A/G beads to immunoprecipitate, and the complexes were detected with anti-mGluR1 (left) or anti-CAL (right) antibody via Western blotting to test the interaction (up). Total lysates were probed with anti-mGluR1 or anti-mGluR5 antibody to visualize the equal expression (down). (B) Cells were transiently transfected with plasmids either for CAL knockdown or scramble control. At 48 h after transfection, cells were harvested to detect the level of CAL using Western blotting. The protein level was normalized to β-actin and expressed as the fold difference of scramble. (C) At 48 h after transfection, cells were stimulated with DHPG (100 μM, 5 min) followed by analysis of the activities of AKT and ERK1/2 by Western blotting (left). Protein levels were normalized to β-actin and represented as the percentage difference of the control shRNA group with DHPG stimulation in AKT (middle) or ERK1/2 (right) phosphorylation. (D) Cells after transfection were pretreated with AIDA (100 μM, 25 min) followed by DHPG stimulation (100 μM, 5 min), and cell lysates were detected for the activities of AKT and ERK1/2 by Western blotting (left). Protein levels were normalized to β-actin and represented as the percentage difference of the AKT (middle) or ERK1/2 (right) phosphorylation compared to control shRNA with DHPG stimulation. (E, F) After transfection, cells were pre-incubated with MPEP (10 μM, 25 min) or LY367385 (100 μM, 25 min) to block mGluR5 and mGluR1, respectively, followed by DHPG (100 μM, 5 min) treatment. Samples were analyzed for the activities of AKT and ERK1/2 via Western blotting (left). Protein levels were normalized to β-actin and represented as the percentage difference of p-AKT (middle) or p-ERK1/2 (right) compared with the control shRNA. Either the control shRNA or CAL shRNA group (in panels for quantification) was calculated as the fold difference relative to its corresponding phospho-AKT or phospho-ERK1/2 immunoreactivity by the presence of stimulation over the absence of stimulation. Data shown in this figure represent the means ± SEM of 3 independent experiments. The statistical significance was determined using Student’s t test. *p < 0.05 versus control shRNA group

