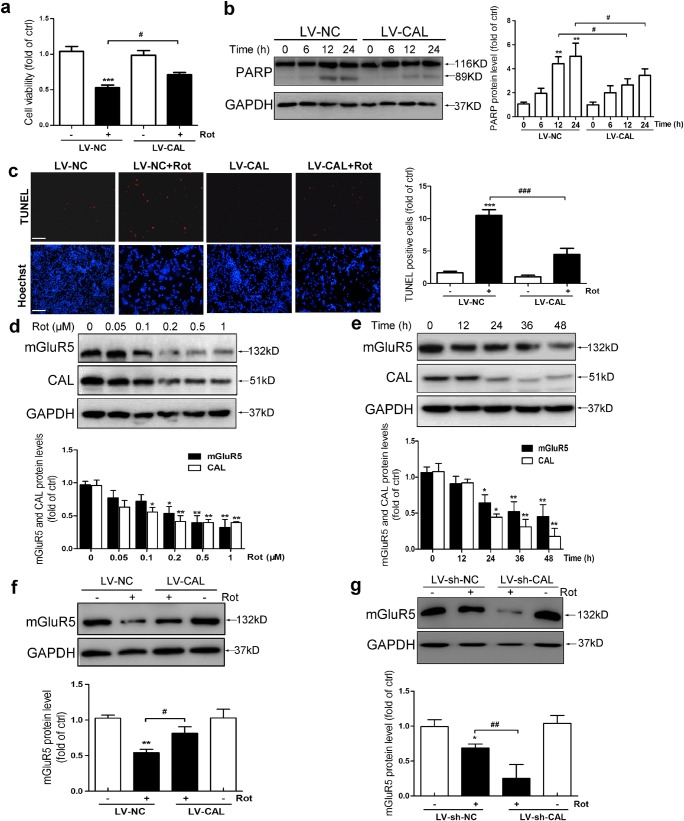
Fig. 3.
CAL attenuates rotenone-induced cell death by regulating mGluR5 expression in MN9D cells. (A, C) Cells were infected with LV-CAL or LV-NC followed by rotenone (0.2 μM) treatment for 24 h. The cells were then subjected to the cell viability assay (A) and cell apoptosis analysis via TUNEL staining (C). Scale bar = 100 μm. (B) Cells infected with LV-CAL or LV-NC were treated with 0.2 μM rotenone for different time periods and then cleaved PARP was determined by Western blotting (left). The protein level was normalized to GAPDH and represented as the fold difference of the control group (right). (D, E) Cells were treated with different doses of rotenone (0, 0.05, 0.1, 0.2, 0.5, 1 μM) for 24 h (D) or 0.2 μM rotenone for different times (0, 12, 24, 36, 48 h) (E), and cell lysates were obtained to detect mGluR5 and CAL protein levels using Western blotting (up). Protein levels were normalized to GAPDH and represented as the fold difference of the control group (down). (F) Cells were infected with LV-CAL or LV-NC followed by 0.2 μM rotenone treatment for 24 h, and lysates were obtained to detect mGluR5 expression (up). The protein level was normalized to GAPDH and represented as the fold difference of the control group (down). (G) After infection with LV-sh-CAL or LV-sh-NC, cells were exposed to rotenone (0.2 μM) for 24 h and analyzed for mGluR5 protein level (up). The protein level was normalized to GAPDH and represented as the fold difference of the control group (down). Untreated cells were used as controls (D, E). Cells infected with LV-NC without rotenone treatment were used as controls (A-C, F). Cells infected with LV-sh-NC without rotenone treatment were used as controls (G). Ctrl: control; Rot: Rotenone. Data shown in this figure represent the mean ± SEM of 3 separate experiments. The statistical significance was determined by 1-way ANOVA followed by Dunnett’s test (A, C–G). A comparison of different times of rotenone treatment between LV-CAL and LV-NC was carried out using 2-way ANOVA analysis (B). *p < 0.05, **p < 0.01, and ***p < 0.001 versus control; #p < 0.05, ##p < 0.01, and ###p < 0.001 compared to the LV-NC/LV-sh-NC group subjected to corresponding rotenone treatment

