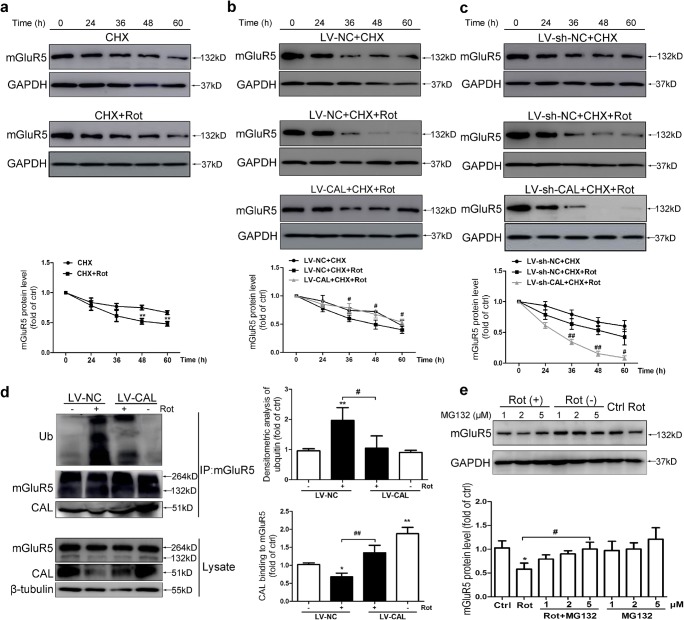
Fig. 4.
CAL inhibits ubiquitin-proteasome-dependent degradation of mGluR5 protein in rotenone-treated MN9D cells. (A) Cells were treated with 0.2 μM CHX for 1 h followed by rotenone exposure for 0–60 h and then Western blotting was performed to detect the alteration in mGluR5 protein level (up). The protein level was normalized to GAPDH and represented as the fold difference of the control group (down). Untreated cells were used as controls. **p < 0.01 versus the CHX group. (B, C) Cells with LV-CAL/LV-NC (B) or LV-sh-CAL/LV-sh-NC infection (C) were treated with 0.2 μM CHX for 1 h followed by rotenone exposure for 0–60 h and then Western blotting was performed to detect the alteration in mGluR5 protein levels (up). Protein levels were normalized to GAPDH and represented as the fold difference of the control group. Cells treated with the drug for 0 h in the LV-CAL/LV-NC or LV-sh-CAL/LV-sh-NC group were used as controls. #p < 0.05, ##p < 0.01 compared to the corresponding CHX+Rot group. (D) Cells were infected with LV-CAL or LV-NC and treated with 0.2 μM rotenone for 24 h. The cell lysates were then subjected to immunoprecipitation with anti-mGluR5 antibody coupled to beads, and the precipitated complexes were probed with anti-CAL antibody to examine the interaction between CAL and the anti-ubiquitin antibody to evaluate mGluR5 ubiquitination using Western blotting. The whole lysates were probed with anti-mGluR5 and anti-CAL antibodies to visualize the expression of mGluR5 and CAL (left). Protein levels were normalized to immunoprecipitated mGluR5 and represented as the fold difference of the control group (right). Cells infected with LV-NC without rotenone treatment were used as controls. *p < 0.05 and **p < 0.01 versus control group, #p < 0.05 and ###p < 0.01 compared to the LV-NC+rotenone group. (E) Cells were pretreated with MG132 (1, 2, 5 μM) for 30 min followed by rotenone (0.2 μM) treatment for 24 h and mGluR5 expression was detected by Western blotting (up). The protein level was normalized to GAPDH and represented as the fold difference of the control group (down). Untreated cells were used as controls. *p < 0.05 versus control group, #p < 0.05 compared to the rotenone group. Data shown in all panels of this figure represent the mean ± SEM of 3 independent experiments. The statistical significance was determined by 1-way ANOVA followed by Dunnett’s test (D, E) or 2-way ANOVA (A–C)

