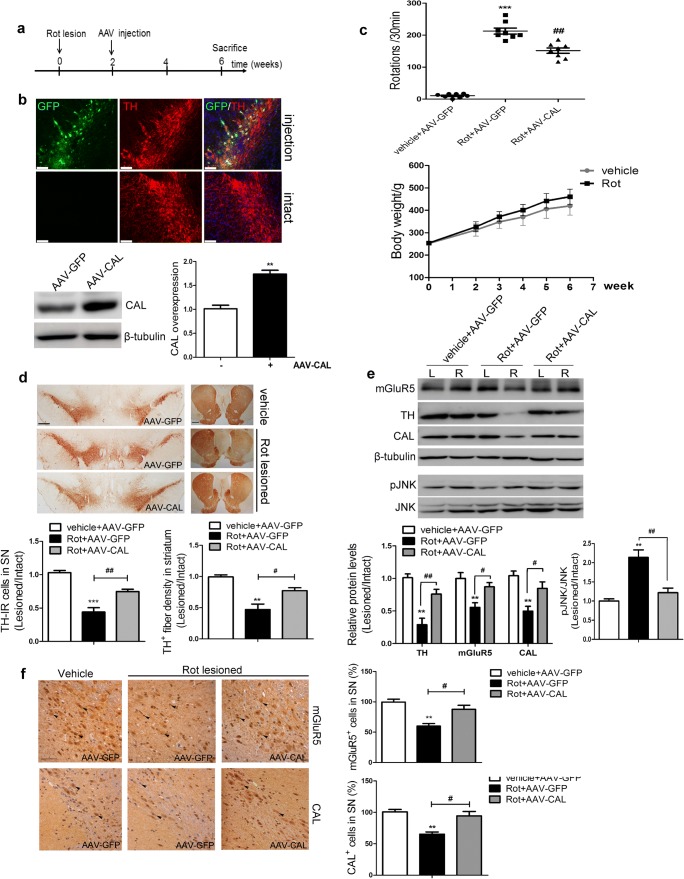
Fig. 7.
CAL overexpression upregulates mGluR5 expression to protect against cell death in the rotenone-induced animal model of PD. (A) The treatment of rats is shown in the scheme. (B) At 4 weeks after AAV injection into the SN of animals, GFP and TH were immuno-labeled (red) and images were captured by confocal microscopy (up), and the expression of CAL in SN tissues was detected by Western blotting (down). Scale bar = 75 μm. The protein level was normalized to β-tubulin and represented as the fold difference of the AAV-GFP group (n = 3 or 4/group). (C) Following virus injection, animal behavioral asymmetry with the apomorphine-induced rotation test and the total hemilateral rotations within 30 min were evaluated (up) (n = 8/group). Body weight each week during surgery was measured (down) (n = 8/group). (D) TH-positive immunoreactive neurons in the SN and TH-IR fibers in the striatum were detected by immunohistochemistry. Scale bar = 500 μm (SN), 1 mm (striatum). Quantification of TH-positive immunoreactivity was represented by the ratio of lesion side to intact side (n = 3 or 4/group). (E) Brain lysates from the left (L) and right (R) striatum were analyzed by Western blotting to observe the alteration in mGluR5, CAL, and p-JNK protein levels. Protein levels were normalized to β-tubulin and represented as the ratio of lesion side to intact side and expressed as the fold difference of the control group (n = 3 or 4/group). (F) mGluR5 and CAL staining in SN sections were detected by immunohistochemistry (left) and the number of positive cells was analyzed (right). The quantification represented the percentage in the control group. The black arrows represented positive cells that were stained brown (scale bar = 50 μm). Data shown in all panels in this figure represent the mean ± SD. The statistical significance was determined using Student’s t test (B) or 1-way ANOVA followed by Dunnett’s test (C–F). Vehicle groups with AAV-GFP infection were used as controls. **p < 0.01, ***p < 0.001 versus control, #p < 0.05, ##p < 0.01 compared to the rotenone lesion with AAV-GFP delivery group

