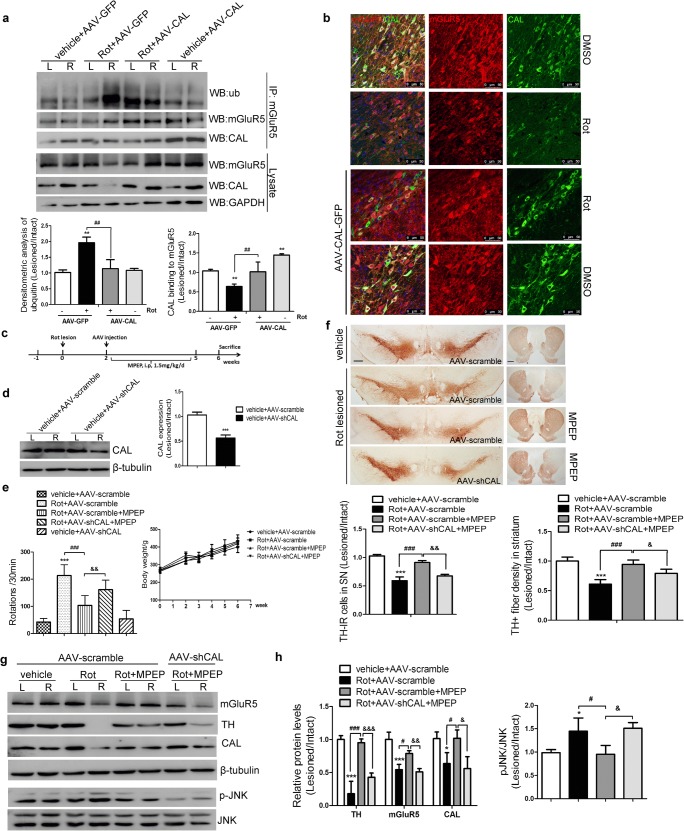
Fig. 9.
CAL regulated mGluR5 degradation through the interaction and deficiency of CAL abrogated the beneficial effect of MPEP in vivo. (A) The brain tissues were lysed for coimmunoprecipitation. Lysates were first incubated with mGluR5 antibody followed by protein-G beads to immunoprecipitate; the complex was detected with anti-ubiquitin or anti-CAL antibodies by Western blot to test mGluR5 ubiquitination and interaction of CAL (up). The whole lysates were detected with mGluR5 and CAL antibodies to visualize the expression (down). Protein levels were normalized to immunoprecipitated mGluR5 and represented as the fold different ratio (right/left) of the control group. (B) Immunofluorescence of mGluR5 (red) and CAL (green) in the SN section showing the protein expression and colocalization. Scale bar = 50 μm. (C) Rats were lesioned by rotenone for 2 weeks followed by CAL knockdown and MPEP administered for 3 weeks as the process shown. (D) The interference efficiency of AAV-shCAL was detected by Western blotting (n = 3, left) and quantification analysis was represented as the ratio of lesion side to intact side by the fold difference of the AAV-scramble group (right). (E) The body weight and apomorphine-induced rotational behavior were monitored (n = 6–8/group). (F) TH-positive immunoreactivity in SN and striatum was detected by immunohistochemistry and quantification represented as the ratio of lesion side to intact side (n = 3). Scale bar = 500 μm (SN), 1 mm (striatum). (G, H) The expression of mGluR5, CAL, TH, and p-JNK were detected by Western blot. Protein levels were normalized to β-tubulin or total JNK and represented as the ratio of lesion side to intact side by the expression of fold difference of the control group (n = 3). Data shown represent the mean ± SD. The statistical significance was determined by 1-way ANOVA followed by Dunnett’s test. *p < 0.05, **p < 0.01, ***p < 0.001 versus control, #p < 0.05, ##p < 0.01, ###p < 0.001 compared to rotenone group, &p < 0.05, &&p < 0.01, &&&p < 0.001 compared to rotenone group with MPEP treatment

