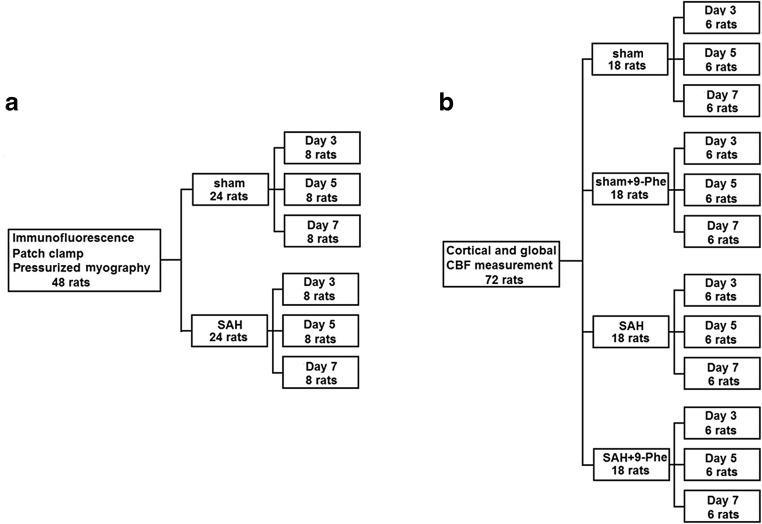
Fig. 1.
Schematic diagrams showing experimental designs of the current study. Forty-eight rats were randomly divided into 2 groups for immunofluorescence, patch clamp, and pressurized myography (sham (n = 24), SAH (n = 24)) and were further subgrouped by time point (day 3, 5, and 7) (a). Another 72 rats were randomly divided into the following 4 groups for cortical and global CBF measurements (sham (n = 18), SAH (n = 18), sham + 9-Phe (n = 18), and SAH + 9-Phe (n = 18)) and were further subgrouped by time point (day 3, day 5, and day 7) (b)

