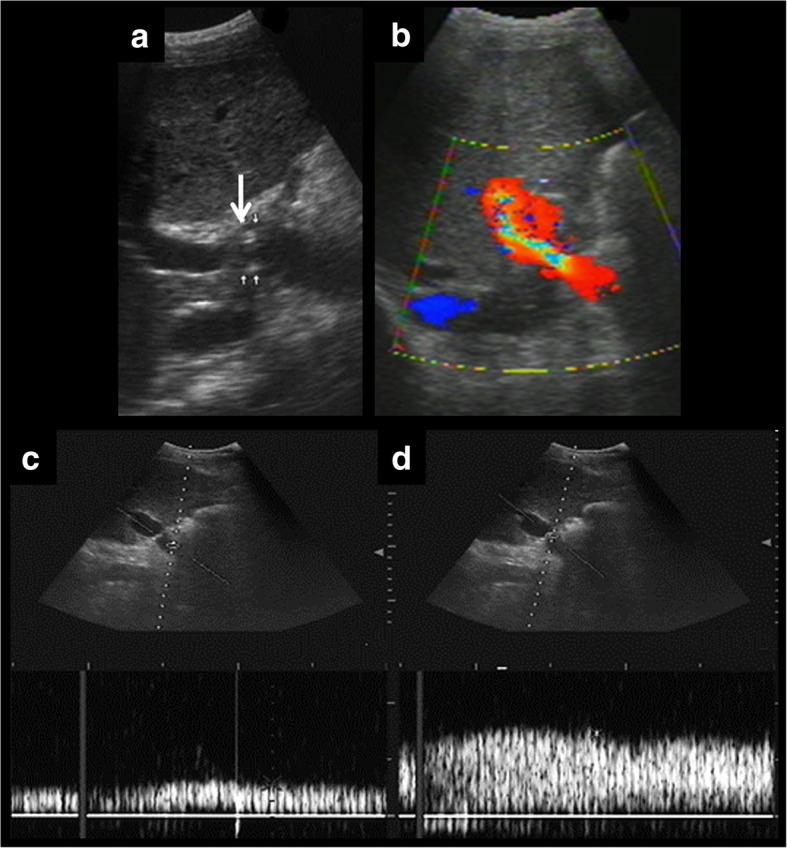
Fig. 10.

Usefulness of spectral curves on the assessment of portal vein stenosis. Ultrasound examination shows multiple points of stenosis (a). Colour Doppler demonstrates turbulent flow (b). Spectral curves show a characteristic pattern before and at the stenosis. In the prestenotic segment (c), we can appreciate a low flow. In the stenotic segment (d), high-speed flow is seen (peak velocity over 125 cm/s). Stenotic/prestenotic ratio is a useful measurement. In this case, the result is clearly more than three
