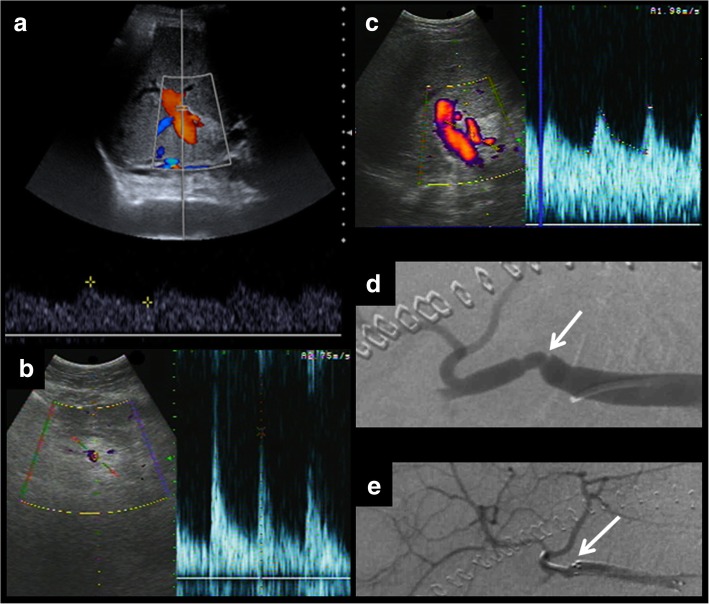
Fig. 4.
The usefulness of spectral curves on the assessment of hepatic artery stenosis. Even in cases of normal colour Doppler examination (a), spectral curves should be obtained. They show a characteristic pattern before and after the stenosis. In the prestenotic segment (b), we can appreciate high peaks and an elevated resistive index. In the poststenotic segment (c), we can see a parvus et tardus pulse and a low resistive index. Angiography can help confirm the diagnosis (d) and perform the treatment (e)

